Scenario 8 - Packet-Tracer in Firewall Threat Defense
Objective
- What - The packet-tracer command on Cisco Secure Firewall is used, generally, for troubleshooting purposes. This command helps network administrators to verify the configuration of access control rules, NAT (Network Address Translation), and other firewall settings. The output of packet-tracer provides information on each step of the packet processing, indicating whether the packet is allowed or denied based on the current firewall configuration.
The packet-tracer command is used to simulate the passage of a packet through the firewall and to evaluate how the firewall processes it. Keep in mind that the availability and functionality of the packet-tracer command can vary depending on the specific Cisco device and software version you are using. - Why - Troubleshooting, and because it enables administrators to verify policy configuration & other firewall settings.
- How - Via NGFW1 Command-line Interface
Lab Tasks
These are the tasks in the scenario below. If you are familiar with the Secure Firewall you may do these on your own, or for step-by-step instructions see below.
- Task 1 - Verify the connectivity between wkst2 PC and CSr60 router.
- Task 2 - Executing packet-tracer on NGFW1
- Task 3 - Understanding the important phases of packet-tracer output.
📘 Note - Completion of the PBR lab is imperative before attempting this exercise. Failure to do so may result in unsuccessful outcomes for this lab.
Lab Topology

Task 1 - Verify the connectivity between wkst1 PC and NGFW1 router
-
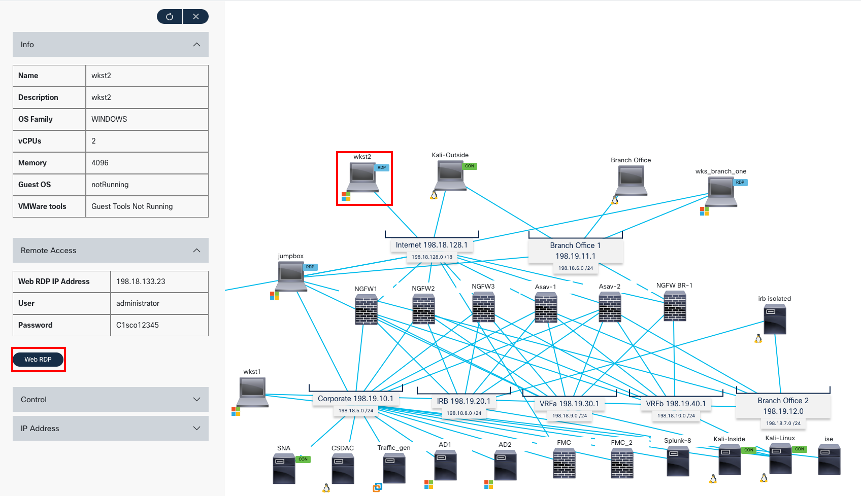
First, we remote desktop to wkst2. We will use this workstation to RAVPN to the firewall.
-
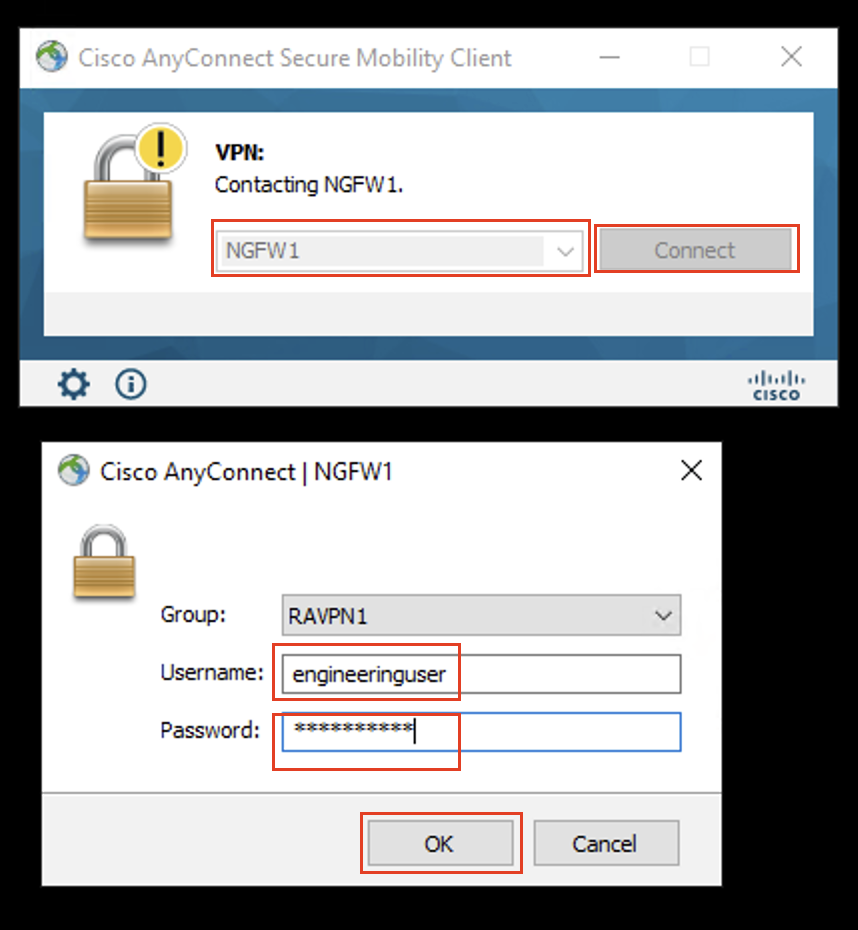
Now, we will open a VPN connection using Anyconnect Secure Client.
-
Open the AnyConnect client (Go to Windows > Cisco > Cisco AnyConnect Secure Mobility Client) and connect to NGFW1 (the profile and NGFW1 information is pre-populated)
- Use the following credentials:
- Username: engineeringuser
- Password: C1sco12345
- Note: These are the same credentials you have configured in the PBR/SGT Lab.
- Use the following credentials:
-
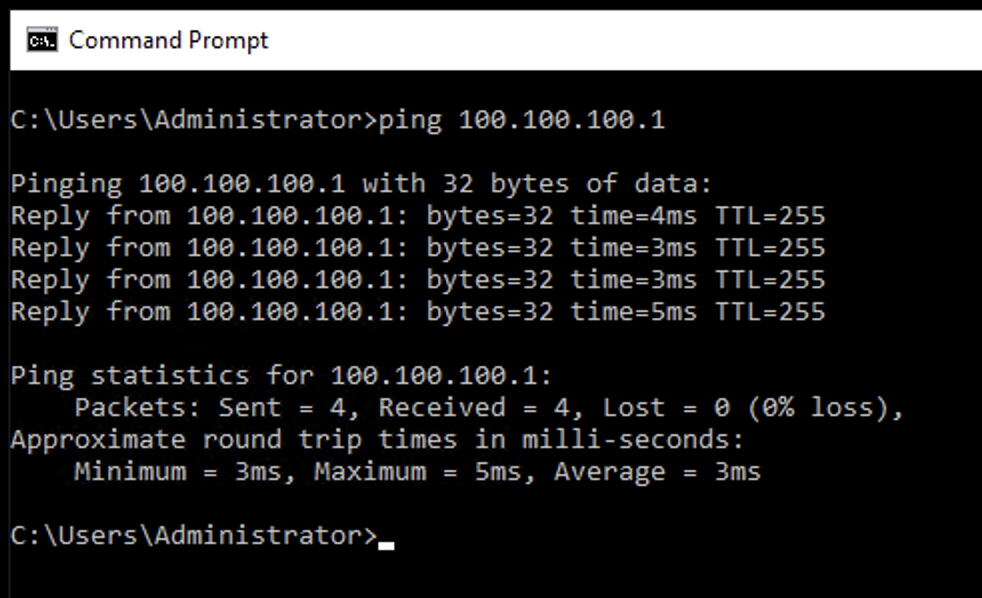
Open the command prompt and ping 100.100.100.1
Task 2 - Executing packet-tracer on NGFW1
-
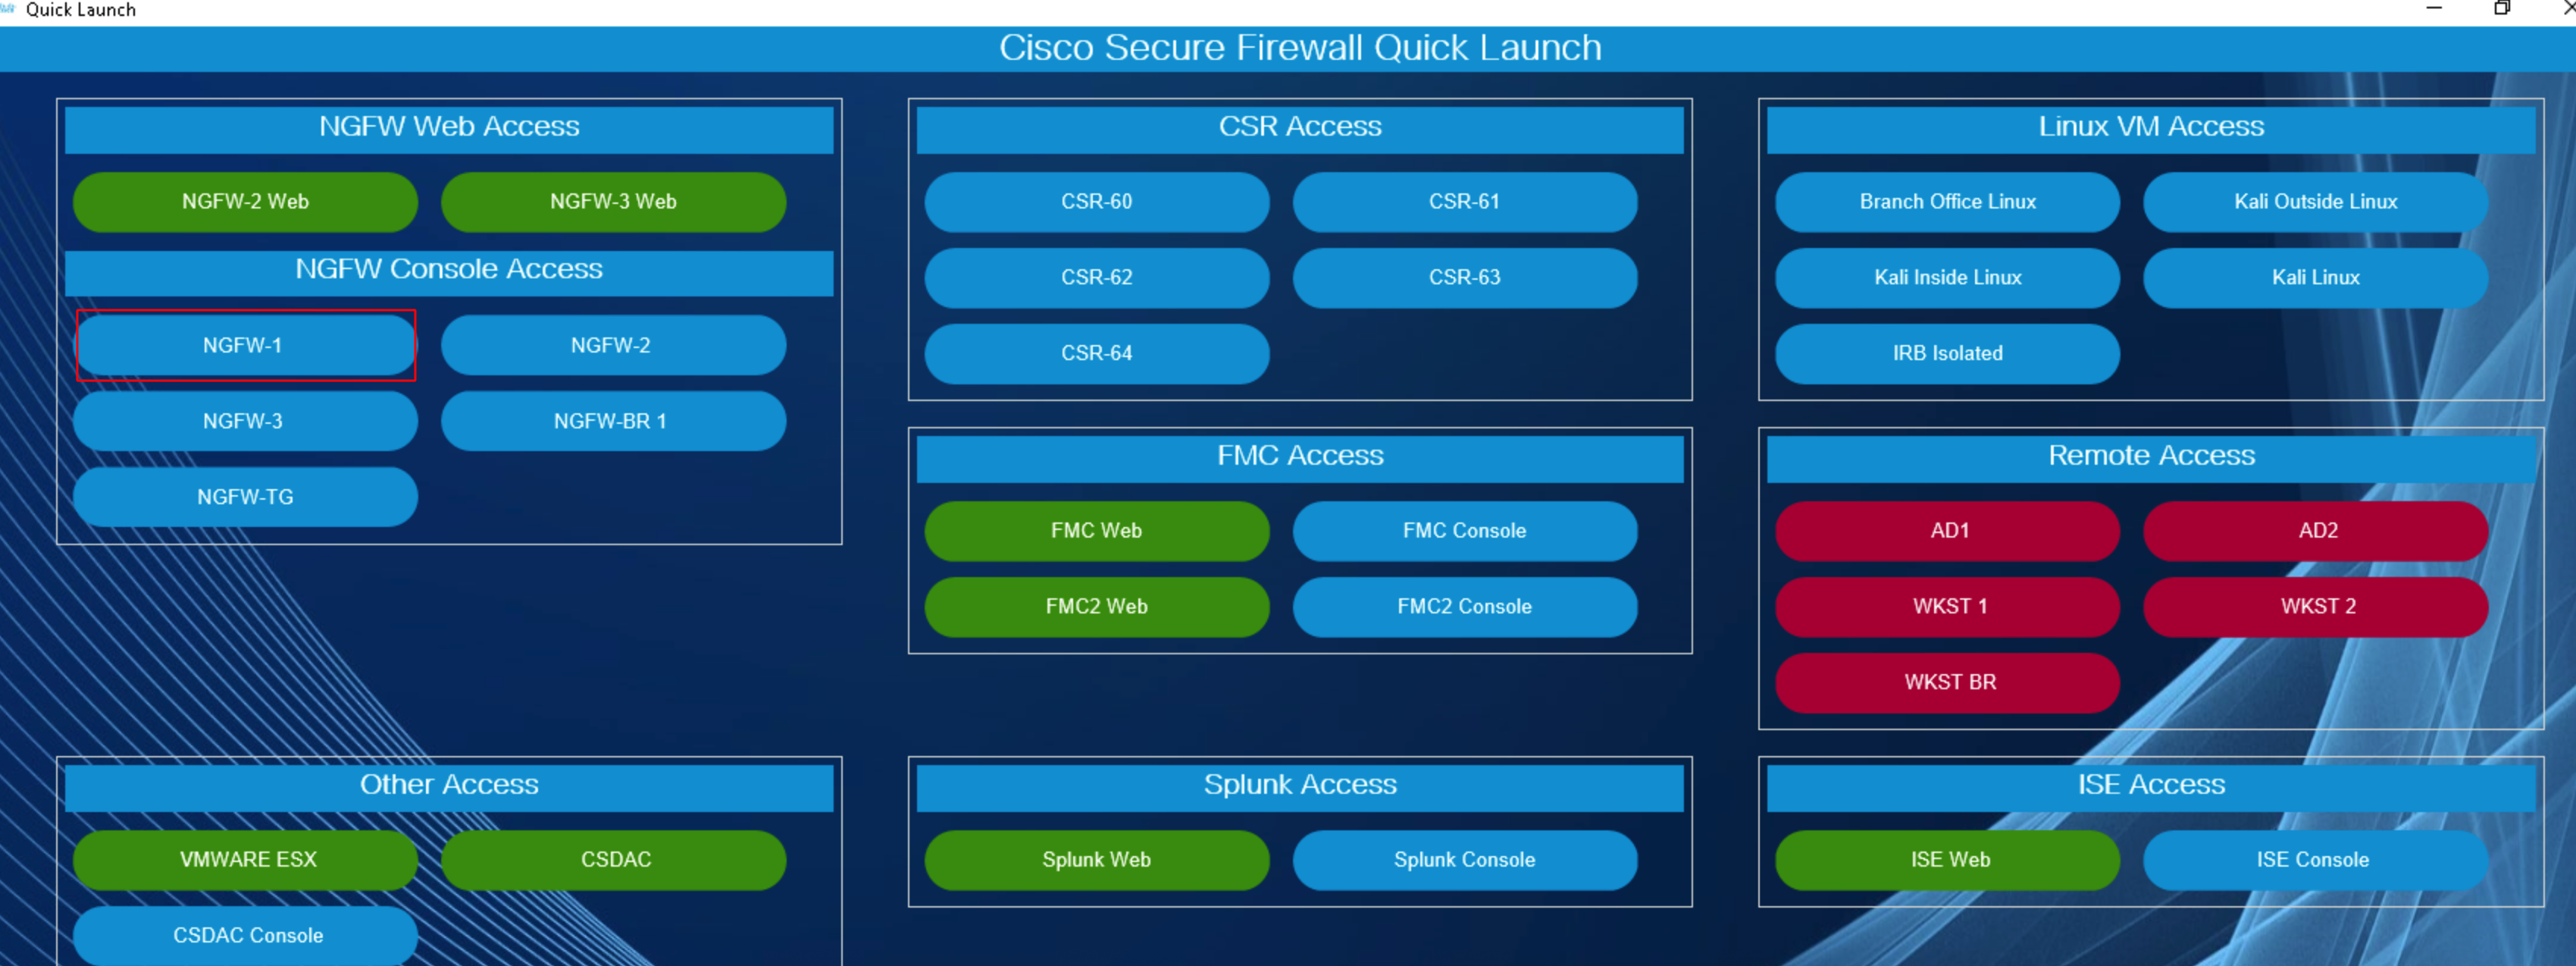
Using the Quick Launcher connect to the CLI of NGFW1. The credentials will be pre-populated
-
Connect to the diagnostic cli by using the command:
- system support diagnostic-cli
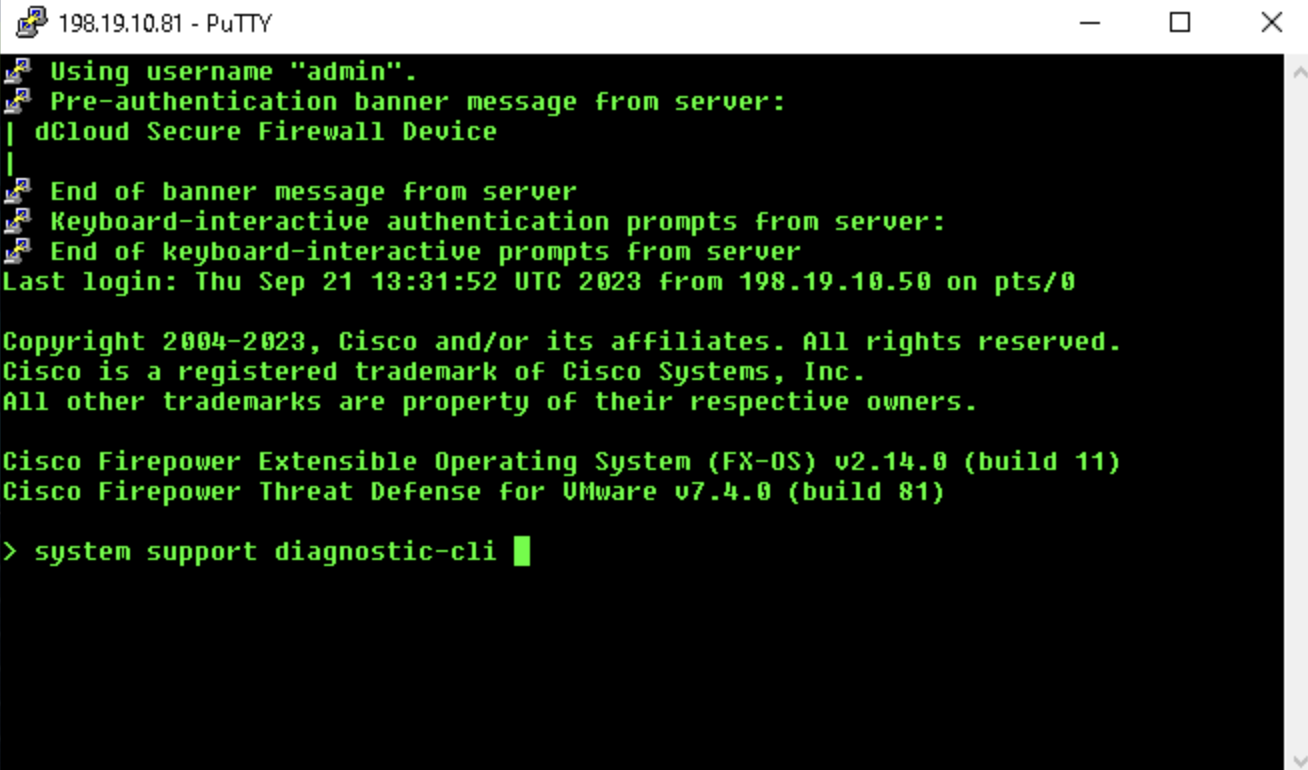
- system support diagnostic-cli
-
Use the "enable" command to log into enable mode (privileged mode) and leave the password as blank.
-
The syntax for packet-tracer is in the following format:
packet-tracer input <source_interface_name> <source_ip> <protocol> <source_port> <dest_ip> <dest_port> [detailed|transmit|xml]
-
In the previous lab task, we had configured a vpn pool 172.16.1.0/24. So, we will simulate traffic using an ip from that subnet as the source ip address.
- type
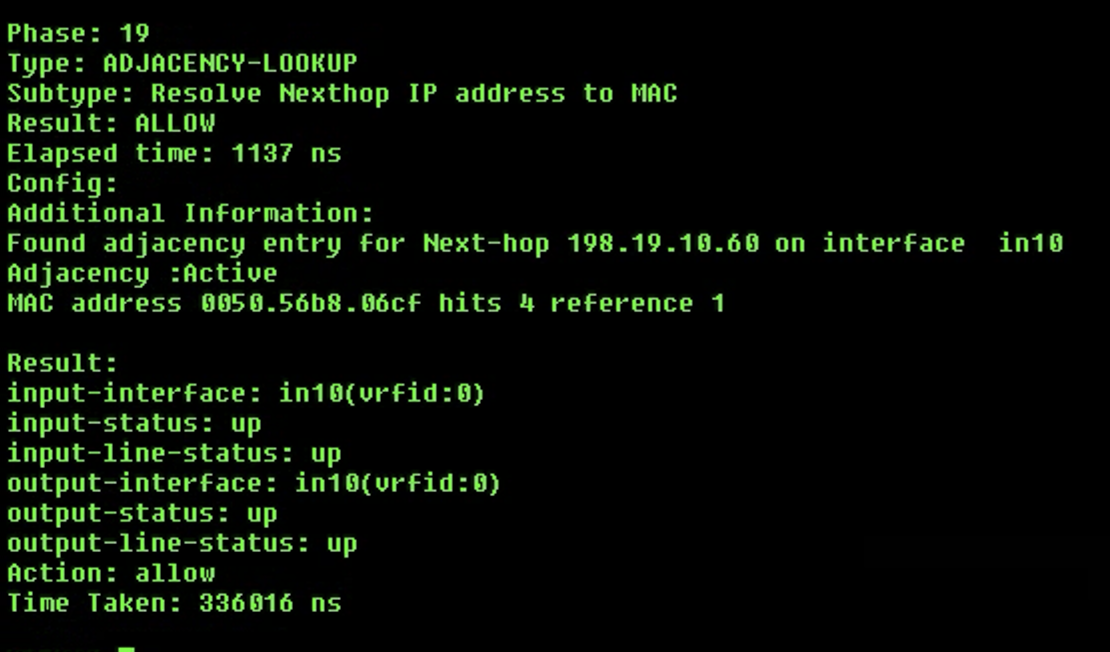
packet-tracer input in10 icmp 172.16.1.1 8 0 100.100.100.1and press enter. - In the above command, we are mentioning the interface the traffic will input from, the ip address it will have, the type of traffic that will enter, and the destination it wants to go to.
- Note:
- Notice how there is a
8 0in the middle in the of the command. This is a type and code that signifies that theicmprequest should be an echo request and the successful error code should be 0.
- Notice how there is a
- type
Task 3 - Understanding the important phases of packet-tracer output
- With the above case, we can see 19 phases that the traffic goes through before reaching it's destination. This number is highly varied over different configuration of FTDs and the routes that the traffic will have to take. Despite the variability, certain phases are constant and repeat, forming the foundational elements of the traffic's progression. Familiarizing oneself with these recurring phases provides insights into the intricate journey of the traffic, facilitating a comprehensive interpretation of the overall process.
- Note: It's essential to note that while the total count of phases may differ, the underlying types of phases remain consistent across different runs.
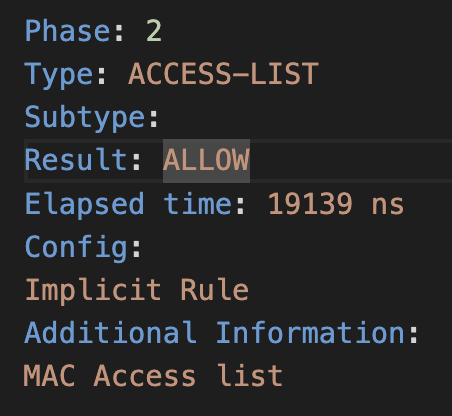
- First one to look at is Phase-2 in this case, the firewall is allowing the packet based on the MAC access list. The absence of a specific subtype and the mention of an implicit rule just indicates that the access list configuration might be relying on default rules for MAC address-based filtering.
- Next comes Phase-3, "INPUT-ROUTE-LOOKUP" refers to a step in the packet processing where the firewall is determining the route that the packet will take through the device. This step involves looking up the routing table to identify the next-hop information for the packet based on its destination IP address.
- At this stage we are not routing the packet but just checking the routing table to check if there is a route or not, and drop the packet and save processing resources if there is no route.
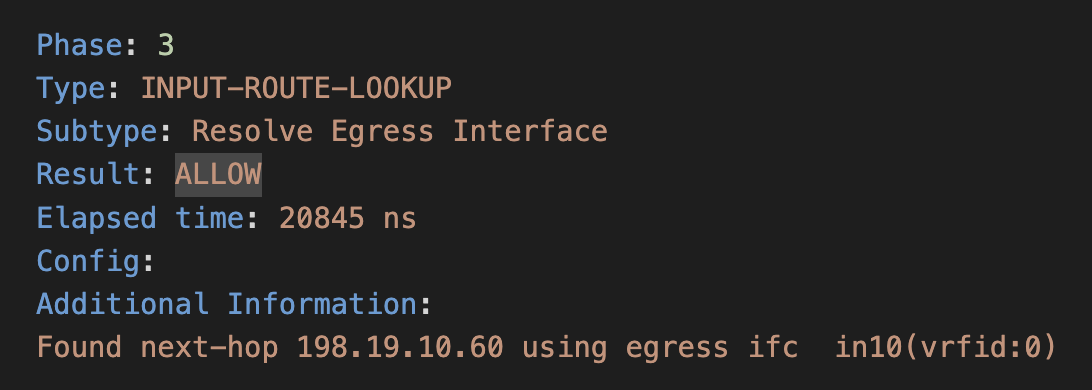
- At this stage we are not routing the packet but just checking the routing table to check if there is a route or not, and drop the packet and save processing resources if there is no route.
- In Phase-5, the output suggests that the packet matches an access list rule that allows the traffic. Additional information suggests that this packet will be sent to Snort for additional processing. Snort is an intrusion detection system (IDS) that analyzes network traffic for signs of malicious activity. The Lina Engine is passing the packet to Snort Engine, where a verdict will be reached based on further analysis. access-list CSMFW_ACL remark rule-id 268436484: ACCESS POLICY: NGFW1 - Mandatory: Provides a remark indicating the purpose or policy associated with the rule ID and so on.

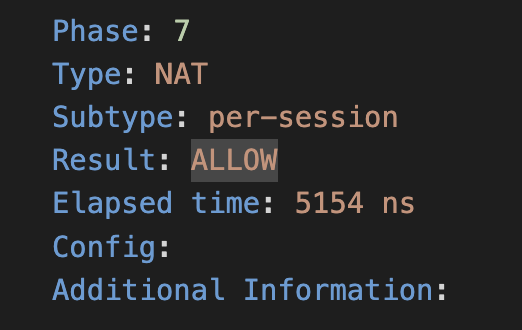
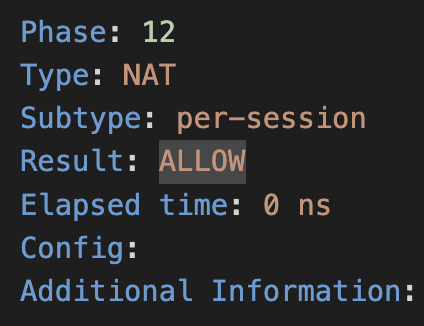
- In Phase-7 and Phase-12, the output indicates that the packet has been processed in the NAT phase, using a "per-session" NAT method, Indicates the specific type or method of NAT being used. In this case, it's "per-session" NAT which means that a unique translation is created for each session. And the result is "ALLOW", indicating that the NAT operation was successful, and the packet is permitted.
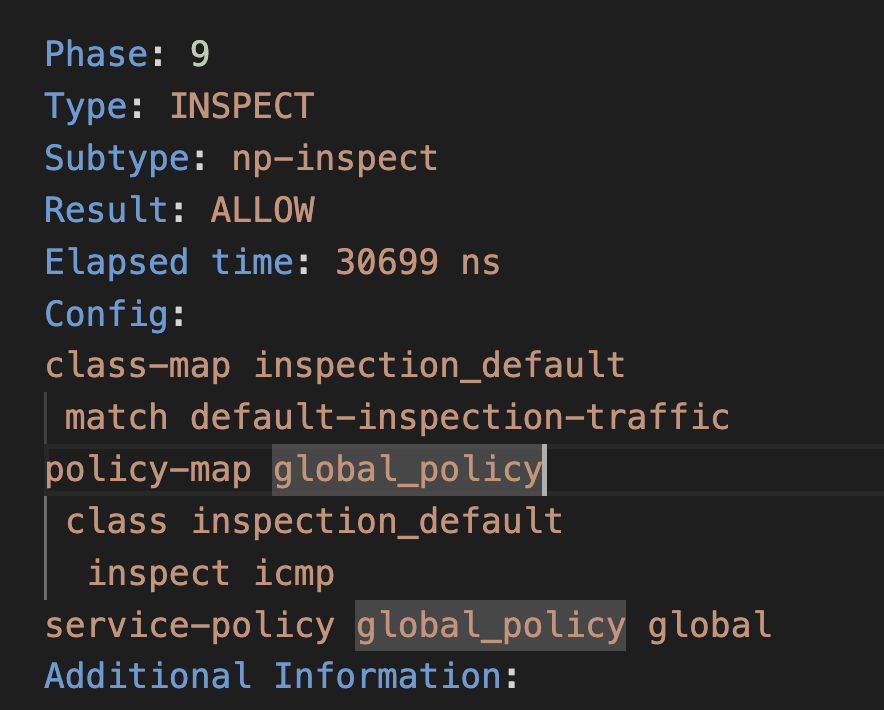
- Phase-9 is where a deep inspection is taking place. This phase will greatly depend on the firewall version you are using and it's configuration. It signifies that the firewall is performing inspection on the packet. Inspection involves the examination of packets to enforce security policies, allow or deny specific protocols, and perform other protocol-specific actions. The "np-inspect" subtype suggests that Network-based Protocol Inspection is being applied. This typically involves examining and processing traffic based on specific application layer protocols, in case this specifically for icmp packets.
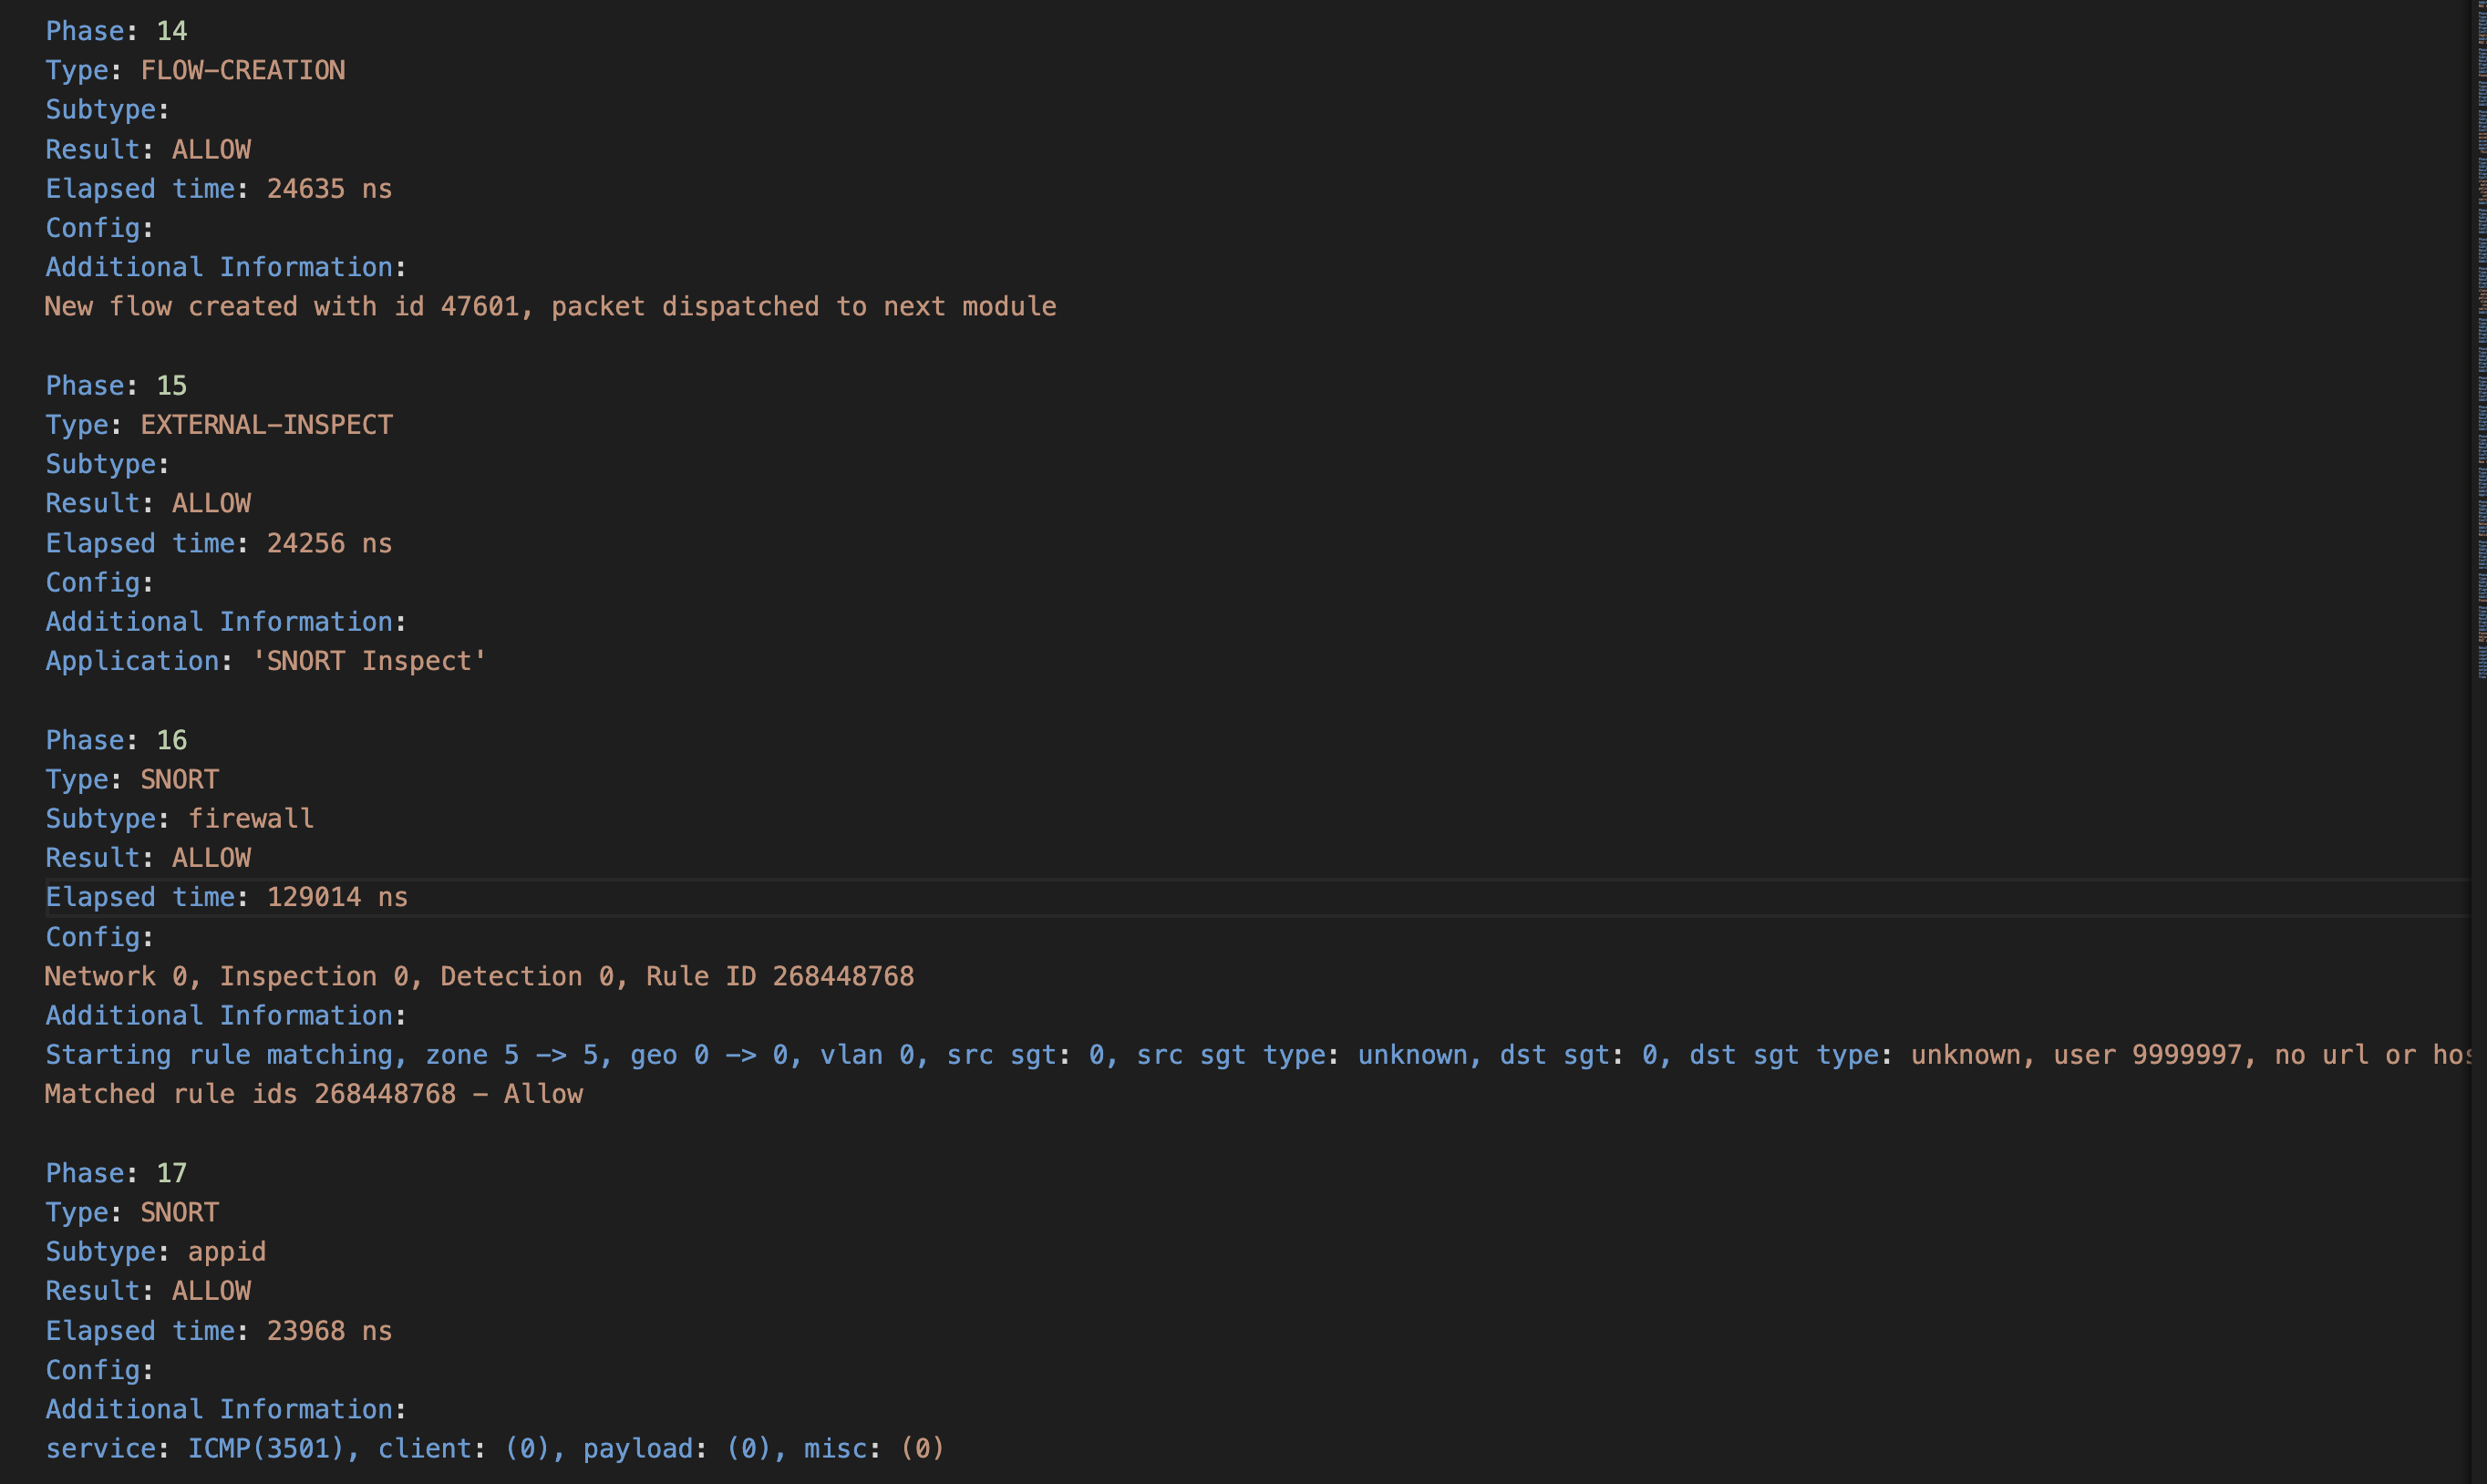
- Now let's look at the snort inspection of the packet, from phases 14 to 17, these phases indicate that the packet has undergone external inspection, Snort firewall inspection, and Snort application identification. In each phase, the result is "ALLOW," suggesting that the packet meets the criteria specified by the respective inspection modules and is allowed to proceed. For example, in phase 16 the criteria was to match the rule built into the snort framework for icmp packets, in phase 17 it was application identification and so on.
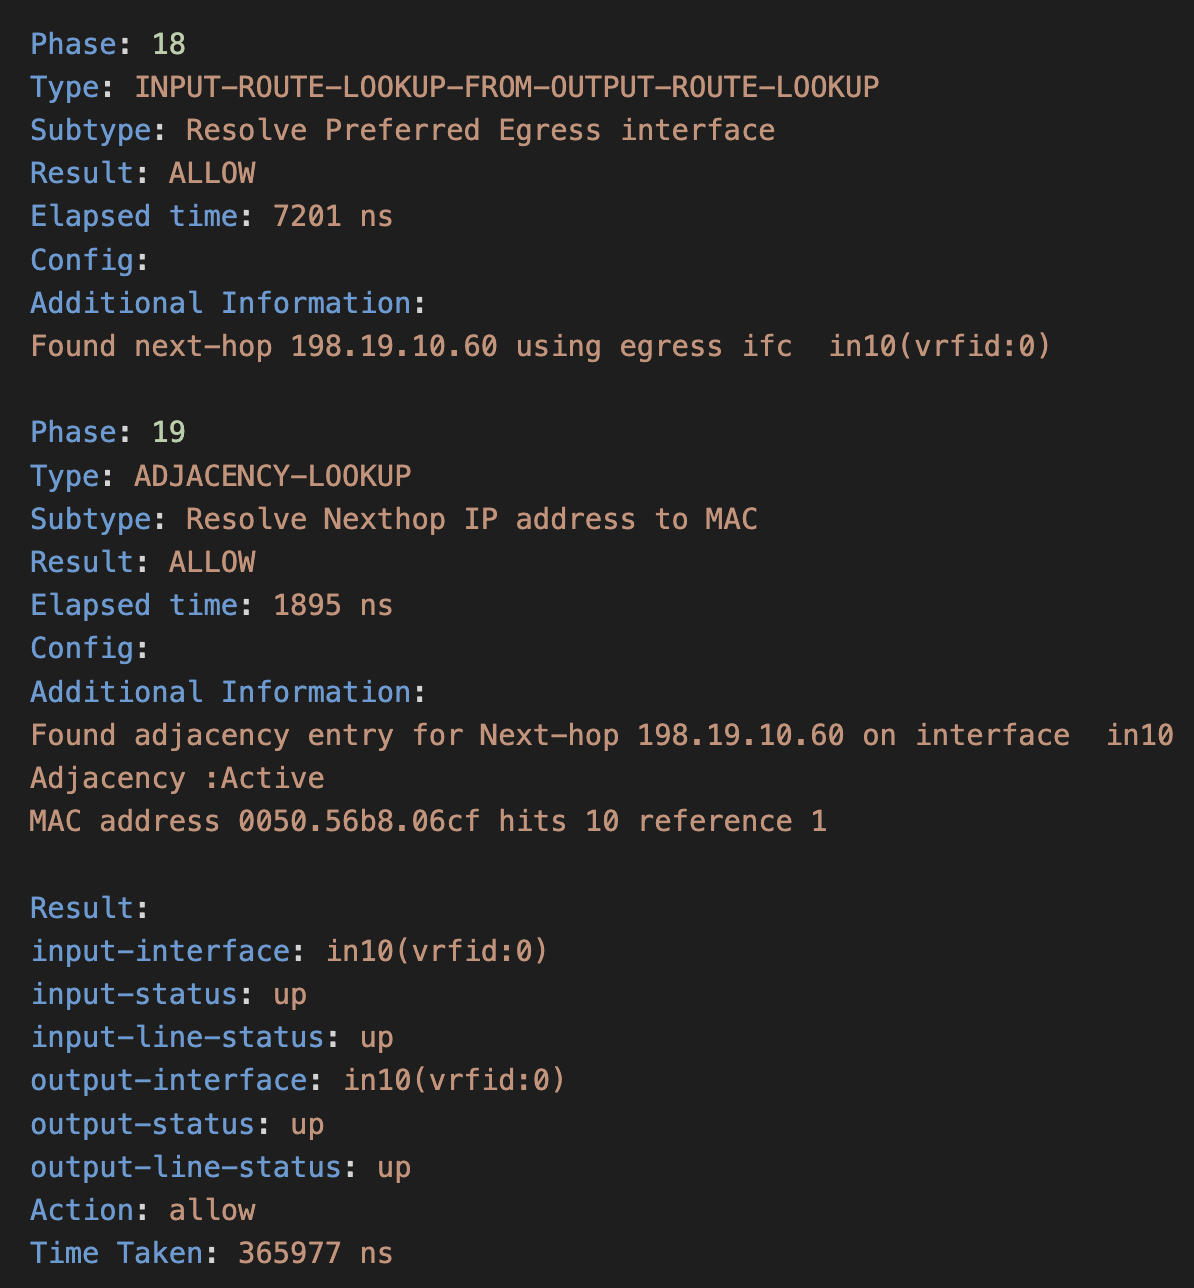
- Phases 18 and 19 are again MAC address lookups to finally allow the packet to reach it's destination after going through the above thorough processing for ensuring safety and no foul play.
Tell us how we are doing
We are doing our best to ensure the scenarios in this lab guides are useful, clear and work as expected.
Please share your thoughts to help us improve or fix any problems you may run into..
Click here to provide your feedback or report an issue with this guide
Updated over 1 year ago

