
Policy-Based Routing (PBR) using HTTP path monitoring
Introduction
Cisco Secure Firewall Release 7.4 introduces support for HTTP path monitoring within Policy-Based Routing (PBR) policies to measure the performance of applications beyond the next hop. This allows administrators to leverage PBR that uses the dynamic performance metrics for the desired applications rather than the metrics on a specific destination IP(s) for steering traffic through the most optimum path.
NOTE:
This feature is supported with Secure Firewall Management Center (FMC) and Secure Firewall Threat Defense devices running release 7.4.
Background Information
In the Cisco Secure Firewall 7.2 release, we added support for dynamic path metrics like RTT, jitter, packet-lost, and MOS to determine the best path for application traffic. These metrics were collected using ICMP probe messages to the interface's default gateway or a specified remote peer.
Release 7.4 introduces an enhanced path monitoring mechanism that uses HTTP probes to reach configured applications and calculates the metrics based on the HTTP ping response. The benefits of this are:
- More deterministic way of measuring application performance up to the application layer.
- Ability to choose the optimum path for application traffic.
- Removes the need to change the firewall configuration whenever an application server IP address changes.
- Monitoring multiple domains for a particular application(s).
How it works
To expand on how this feature works, this section reviews the core components of policy based routing and path monitoring.
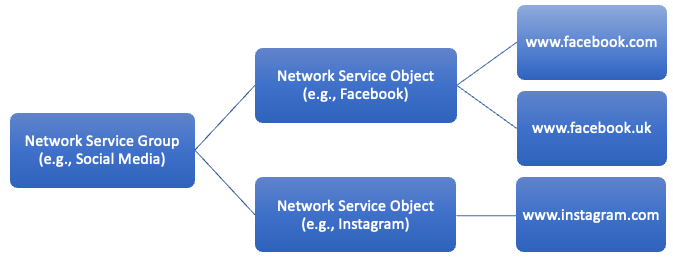
Policy Based Routing Components
- Network Service Object
An object associated with a particular application that is used within policy-based routing. These objects map to specific applications which are further mapped to various domains. - Network Service Group (NSG)
Network Service Groups are groups of applications that the firewall uses to determine the path based on the configuration. Cisco Secure Firewall Management Center auto generates Network Service Groups (NSG) based on the extended access lists configured for policy based routing.
At a high level, this feature works as follows:
- Policy based routing is configured on the FMC, which creates Network Service Groups (NSG) with the selected applications. The same NSGs are used to configure path monitoring as well.
- HTTP probes are sent to measure path metrics (i.e. RTT, jitter, packet-lost, and MOS) for selected applications in NSGs across all the egress interfaces configured for path monitoring.
- Metrics are calculated based on HTTP response and PBR uses the results for best path selection.
End to End flow
This section describes the end-to-end flow:
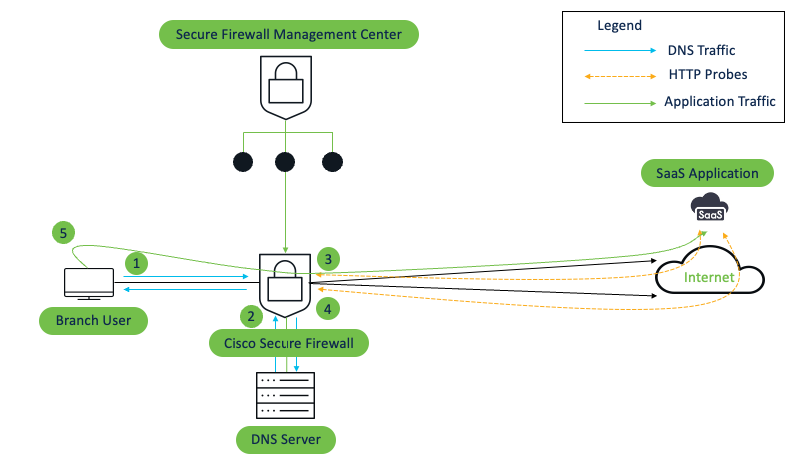
End to End Flow
- User initiates the DNS request for a particular application(s).
- Secure Firewall Threat Defense snoops the DNS response, reviews the DNS records within the response, and then stores the application/domain information and their corresponding IP address(es).
- Path monitoring module within the threat defense device uses the above information i.e. IP addresses for particular applications and sends HTTP probes to the configured applications on the egress interfaces where the path monitoring is enabled.
- Once the response is received, FTD derives the metrics like Jitter, Packet loss, Round-trip-time, and MoS for each interface which are then shared with the Policy Based Routing module within the threat defense device.
- Based on the available metrics, the application traffic is steered between the interfaces based on whichever interface is better for the particular metric type.
Prerequisites
- To ensure that DNS requests are not resolved by rogue DNS servers and are indeed locked to desired DNS servers, ensure that you configure trusted DNS servers for threat defense on the Cisco Secure Firewall Management Center.
- All the egress paths should be in the same ECMP group for the PBR policy to be applicable.
NOTE:
For more details, please refer to the following resource: https://secure.cisco.com/secure-firewall/docs/policy-based-routing-with-path-monitoring
Configuration
Enable HTTP based Application Monitoring
On a threat defense device with the fresh installation of the 7.4 release, HTTP based application monitoring option is enabled by default for the interfaces.
For threat defense devices upgraded from prior releases, in case IP based path monitoring is configured, the device would continue to use the IP based path monitoring only. If not, then the administrator needs to configure either IP based path monitoring or HTTP based application monitoring to leverage this feature. Additionally, both can be configured together as well.
- On FMC, navigate to Device > Device Management , and edit the threat defense device.
- Within the selected FTD, click the pencil icon on the far right of the egress/WAN interface(s)
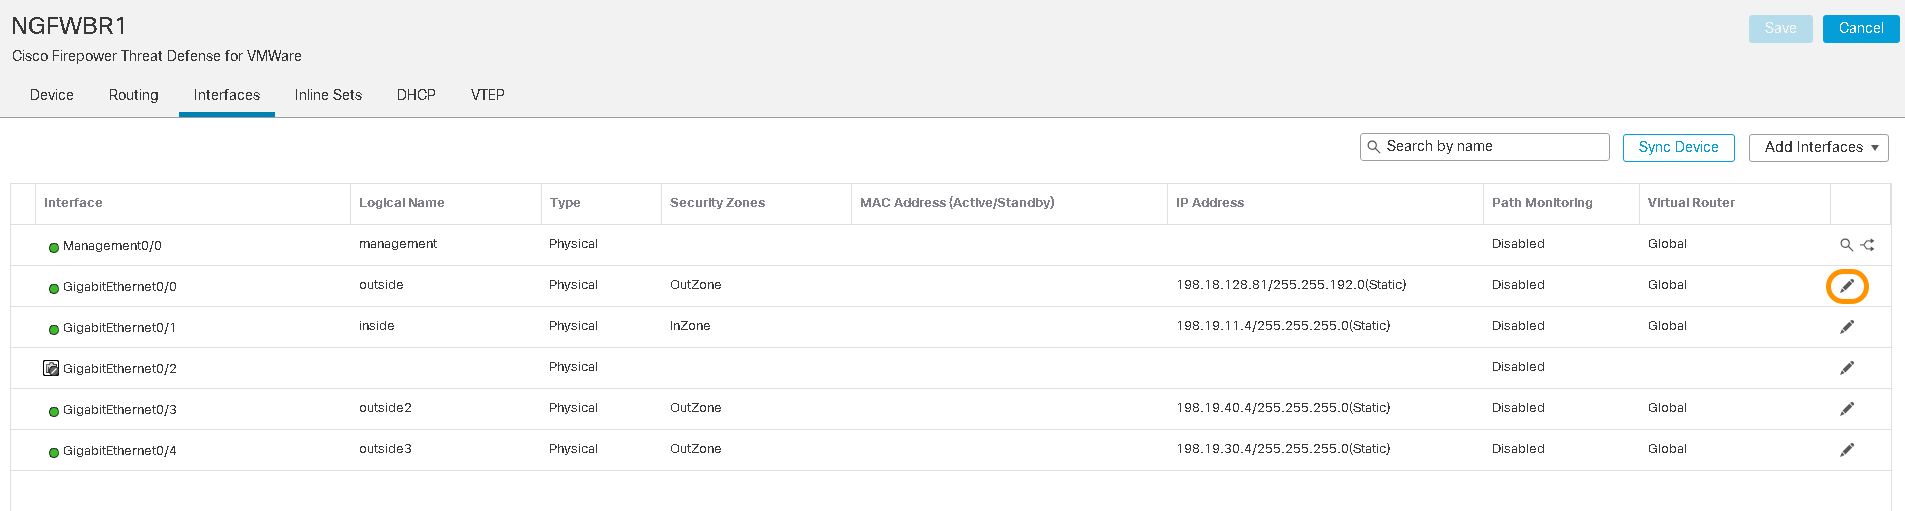
Threat Defense Interfaces
- Click the Path Monitoring tab and ensure HTTP based Application monitoring is enabled. Notice that currently, no applications are listed under the HTTP monitoring section.
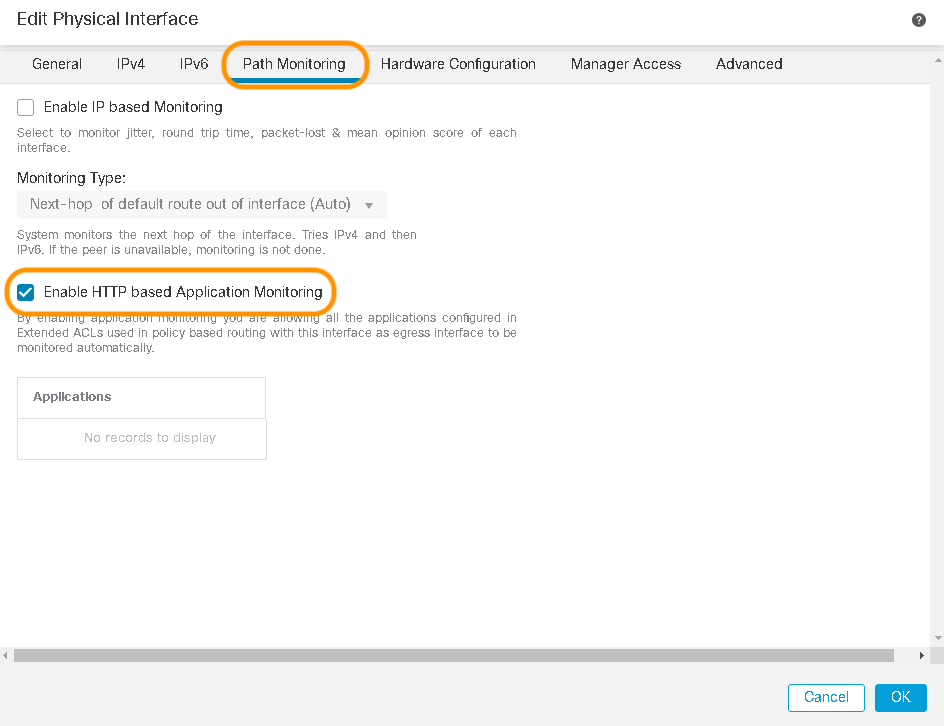
Enable HTTP Based Application Monitoring
Select applications for path monitoring and policy based routing
- Navigate to Objects > Object Management > Access List > Extended and click on Add Extended Access List to add an access list that will be used in Policy Based Routing.
- In the pop up box, configure the following details:
- Name: DIA-Collaboration
- Click on Add
- Click the Application field. Search for webex, and select the desired application(s) to be configured.
- Click Add and then Save at the bottom.
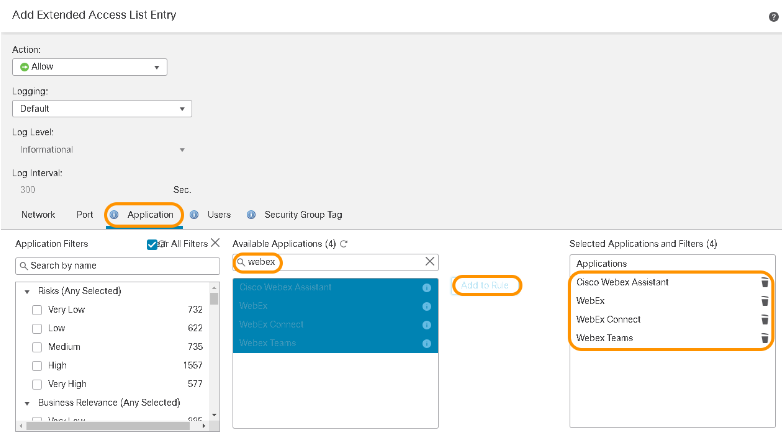
Selecting Applications for Path Monitoring
Configure ingress interface within policy based routing
- On FMC, navigate to Device > Device Management , and edit the threat defense device.
- Navigate to Routing tab > Policy Based Routing and click Add
- Click on the arrow for the Ingress Interface field and select the interface(s) from where the traffic will be sourced which needs to be routed based on the policy based routing and path monitoring.
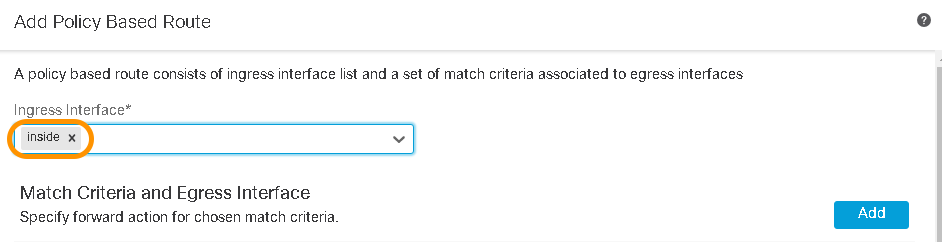
Ingress Interface
Configure matching criteria and egress interface with dynamic path metrics
- Click Add within the Match Criteria and Egress Interface section
- Within the pop up window, for Match ACL, select the DIA-Collaboration extended access list from the drop down menu
- Keep the setting for Send To as Egress Interfaces and change the Interface Ordering to Minimal Jitter from the drop down menu.
- Click the "+" icon adjacent to the interfaces to select the egress interface(s) for policy based routing and click Save.
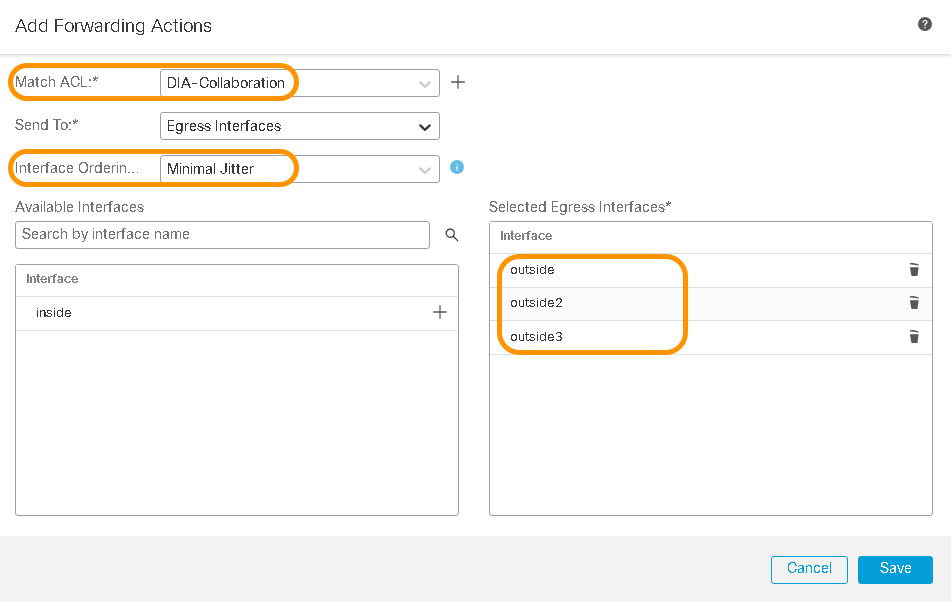
Egress Interfaces
- The final PBR configuration looks like the image below. Click Save again to confirm the configuration.
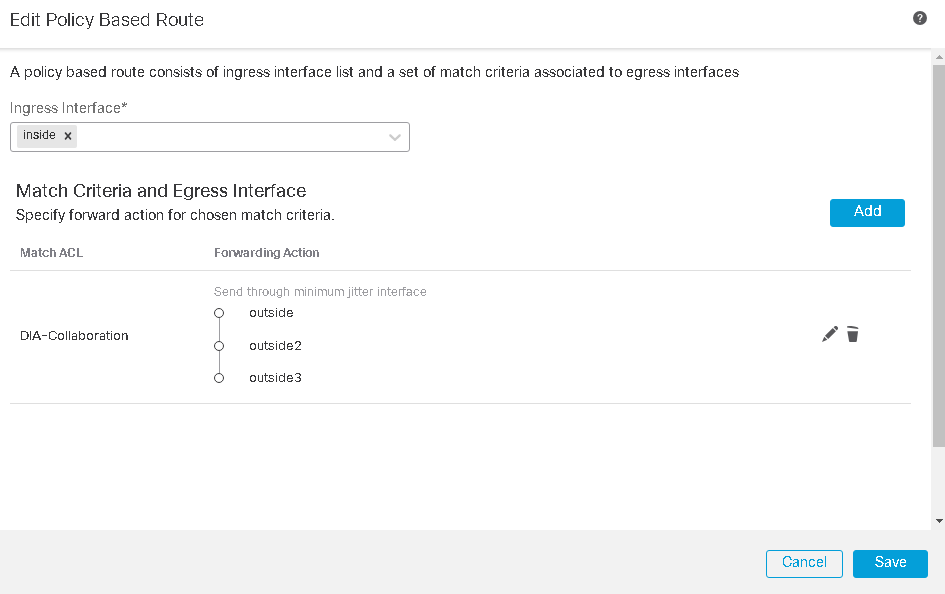
Final Policy Based Routing Configuration
- Click Save on top right to save all the changes.
Note:
The association of the applications to the egress interface happens only when a PBR rule is configured with the following conditions:
- Minimal Jitter
- Maximum Mean Opinion Score
- Minimal Round-Trip Time
- Minimal Packet Loss
- Once the configuration is saved and deployed, navigate to the Path Monitoring tab within the interface configuration on the threat defense device and notice that applications configured in the PBR section show up under the HTTP based Path Monitoring section.
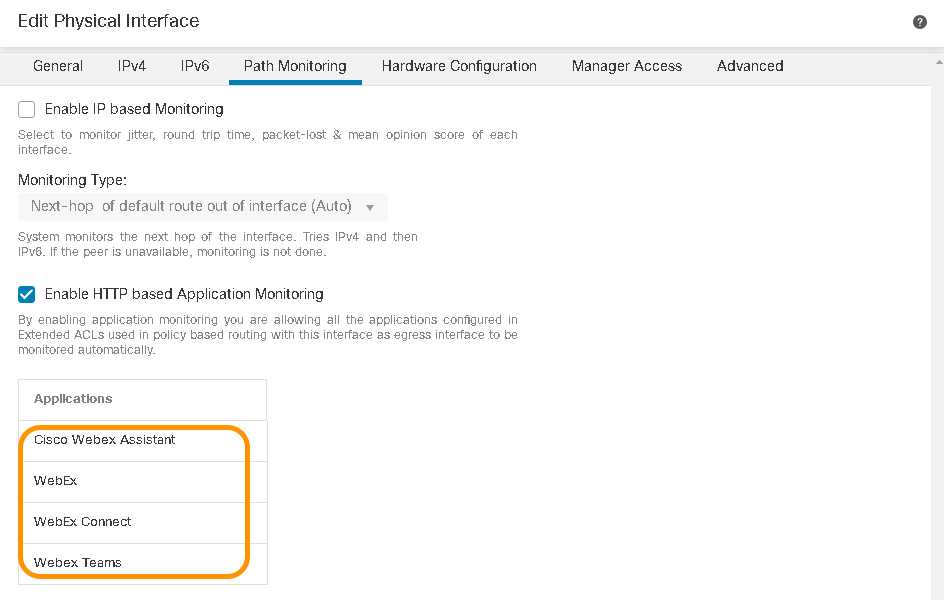
Path Monitoring Applications
Verification
- To verify the HTTP based path monitoring feature, initiate the application traffic (in this example, WebEx) and verify the path taken by navigating to Unified Events under the Analysis tab.
NOTE:
Notice the application traffic initially taking the path via outside interface and once a better path is available based on the metric calculation (in this example, jitter), traffic is sent out via the outside2 interface.
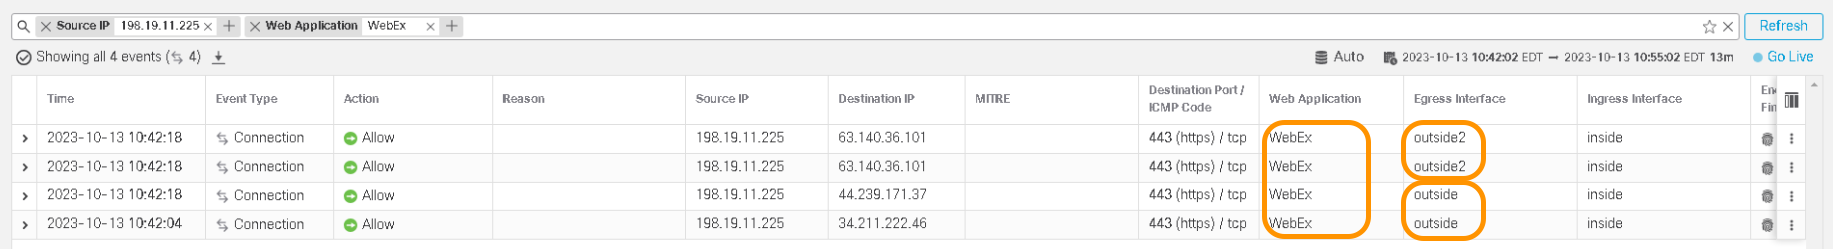
Verification of Path Taken
- To verify the changes in the path due to dynamic path metrics or the interfaces that the threat defense chooses to steer traffic based on the configured PBR policy, navigate to Overview > Dashboard > WAN Summary and click on Uplink Decisions.
In the highlighted event, notice the PBR policy selecting the outside2 as the best path since its jitter metrics became better than outsideinterface.
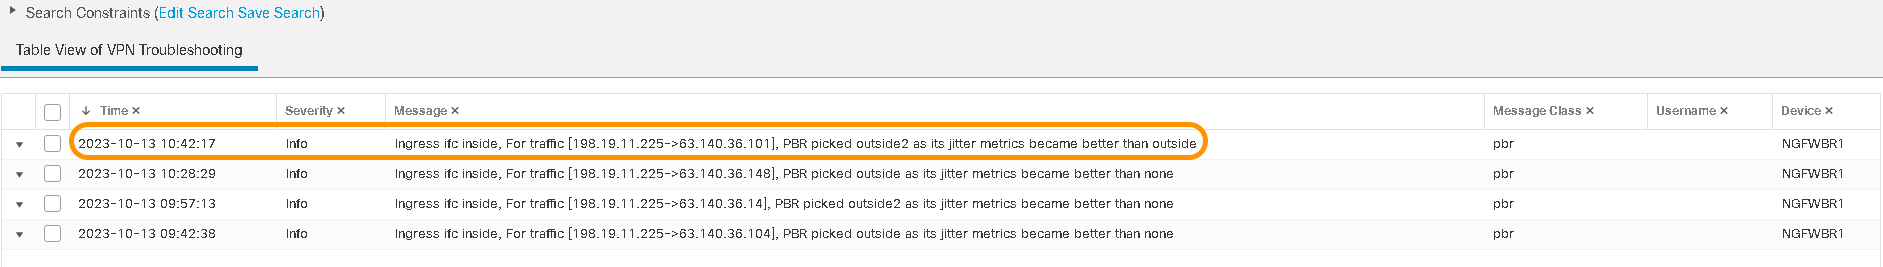
Uplink Decisions
Here are some CLI commands you can use for verification:
- This command shows the access-list that is associated to policy based route
> show access-list
access-list DIA-Collaboration; 1 elements; name hash: 0xfa3c0270
access-list DIA-Collaboration line 1 extended permit ip any object-group-network-service FMC_NSG_386547078770 (hitcnt=39) 0x4a1faea4
  >
- This command shows information about the path-monitoring, including the current value of the relevant metric on the path-monitoring enabled interfaces.
> show route-map
route-map FMC_GENERATED_PBR_1697180863502, permit, sequence 5
  Match clauses:
    ip address (access-lists): DIA-Collaboration

  Set clauses:
   adaptive-interface jitter outside (44) outside2 (21) outside3 (95
>
- This command shows the deployed configuration for specified interfaces. The path monitoring configuration is mapped to egress interfaces while policy based routing configuration is mapped to ingress interface
> show running-config interface
interface GigabitEthernet0/0
 nameif outside
 cts manual
  propagate sgt preserve-untag
  policy static sgt disabled trusted
 security-level 0
 zone-member ECMP-WAN
 ip address 198.18.128.81 255.255.192.0
 policy-route cost 10
policy-route path-monitoring object-group network-service FMC_NSG_386547078770
!
interface GigabitEthernet0/1
 nameif inside
 cts manual
  propagate sgt preserve-untag
  policy static sgt disabled trusted
 security-level 0
 ip address 198.19.11.4 255.255.255.0
policy-route route-map FMC_GENERATED_PBR_1697180863502
!
!
interface GigabitEthernet0/3
 nameif outside2
 cts manual
  propagate sgt preserve-untag
  policy static sgt disabled trusted
 security-level 0
 zone-member ECMP-WAN
 ip address 198.19.40.4 255.255.255.0
 policy-route cost 10
policy-route path-monitoring object-group network-service FMC_NSG_386547078770
!
interface GigabitEthernet0/4
 nameif outside3
 cts manual
  propagate sgt preserve-untag
  policy static sgt disabled trusted
 security-level 0
 zone-member ECMP-WAN
 ip address 198.19.30.4 255.255.255.0
 policy-route cost 20
  policy-route path-monitoring object-group network-service FMC_NSG_386547078770
>
- This command lists the domains for which application traffic is received. This command also lists out reachability status and associated metrics
> show path-monitoring
Interface: outside3 (GigabitEthernet0/4)
Remote NSG: FMC_NSG_386547078770
    Network Service: WebEx
    Domain name: webex.com
    Remote peer reachable: No
  Statistics should be available in ~80 second(s)

Interface: outside (GigabitEthernet0/0)
Remote NSG: FMC_NSG_386547078770
    Network Service: WebEx
    Domain name: webex.com
    Remote peer reachable: Yes
    RTT average: 46829 microsecond(s)
    Jitter: 6503 microsecond(s)
    Packet loss: 0%
    MOS: 4.37
    Last updated: 0 second(s) ago


Interface: outside2 (GigabitEthernet0/3)
Remote NSG: FMC_NSG_386547078770
   Network Service: WebEx
    Domain name: webex.com
    Remote peer reachable: Yes
    RTT average: 112675 microsecond(s)
    Jitter: 344190 microsecond(s)
    Packet loss: 0%
    MOS: 1.38
    Last updated: 0 second(s) ago
-
This command lists all the configured domains and gives information related to resolved IP address, last 30 probes sent and their timestamp.
NOTE:
Notice the IP address of 63.140.36.119 associated to domain webex.com and branch ID 1120324107 and is used for HTTP probing.
> show path-monitoring detail

************ Truncated Output ************

Interface: outside3 (GigabitEthernet0/4)
Remote NSG: FMC_NSG_3865470787
    Network Service: WebEx
    Domain name: webex.com
    Branch ID: 1120324107
    Resolved IP: 63.140.36.119
    HTTP response status: HTTP TCP connection failure
    Remote peer reachable: No
    Statistics should be available in ~70 second(s)

    Internal data:
    Version: 0
        Total probes sent: 365
        Total probes pending: 365
        Current probes pending: 31
        Current RTT sum: 0
        Current RTT square sum: 0
        Flags: 0x4
        Current queue index: 24
        Index:  0, Timestamp:  16937450621510, RTT:       0
        Index:  1, Timestamp:  16947496364312, RTT:       0
        Index:  2, Timestamp:  16957564130148, RTT:       0
        Index:  3, Timestamp:  16967587891394, RTT:       0
        Index:  4, Timestamp:  16977637705730, RTT:       0

 ************ Truncated Output ************

Interface: outside (GigabitEthernet0/0)
Remote NSG: FMC_NSG_386547078770
Network Service: WebEx
    Domain name: webex.com
    Branch ID: 1120324107
    Resolved IP: 63.140.36.119
    HTTP response status: 200
    Remote peer reachable: Yes
    RTT average: 46829 microsecond(s)
    Jitter: 6503 microsecond(s)
    Packet loss: 0%
    MOS: 4.37
    Last updated: 2 second(s) ago

    Internal data:
    Version: 209
        Total probes sent: 432
        Total probes pending: 1
        Current probes pending: 0
        Current RTT sum: 1453306
        Current RTT square sum: 69403104726
        Flags: 0x2
        Current queue index: 24
        Index:  0, Timestamp:               0, RTT:   48170
        Index:  1, Timestamp:               0, RTT:   50257
        Index:  2, Timestamp:               0, RTT:   52330
        Index:  3, Timestamp:               0, RTT:   49035
        Index:  4, Timestamp:               0, RTT:   48878
        Index:  5, Timestamp:               0, RTT:   47291

 ************ Truncated Output ************

Interface: outside2 (GigabitEthernet0/3)
Remote NSG: FMC_NSG_386547078770
Network Service: WebEx
    Domain name: webex.com
    Branch ID: 1120324107
    Resolved IP: 63.140.36.119
    HTTP response status: 200
    Remote peer reachable: Yes
    RTT average: 112675 microsecond(s)
    Jitter: 344190 microsecond(s)
    Packet loss: 0%
    MOS: 1.38
    Last updated: 2 second(s) ago

    Internal data:
    Version: 209
        Total probes sent: 365
        Total probes pending: 20
        Current probes pending: 0
        Current RTT sum: 3429810
        Current RTT square sum: 3937343781640
        Flags: 0x2
        Current queue index: 24
        Index:  0, Timestamp:               0, RTT:   47196
        Index:  1, Timestamp:               0, RTT:   47679
        Index:  2, Timestamp:               0, RTT:   51352
        Index:  3, Timestamp:               0, RTT:   46788
        Index:  4, Timestamp:               0, RTT:   47911
        Index:  5, Timestamp:               0, RTT:   47775

 ************ Truncated Output ************
 >
- This command displays the snooped DNS records with their mapped IP address and branch ID.
> show dns

DNS Trusted Source enabled for DHCP Server Configured
DNS Trusted Source enabled for DHCP Client Learned
DNS Trusted Source enabled for DHCP Relay Learned
DNS Trusted Source enabled for DNS Server Configured
DNS Trusted Source not enabled for Trust-any
DNS Trusted Source: Type: IPs : Interface : Idle/Timeout (sec)
    DNS Server Configured: 198.19.10.100: <ifc-not-specified> : N/A
DNS snooping IP cache: 260 in use, 345 most used
Address                              Idle(sec) Timeout(sec) Hit-count          Branch(es)
72.251.232.229                        84         120           0                 1420840831
104.244.42.3                          85         120           8                 1114872933, 2228213111
104.18.32.137                         87         276           0                 1750981745
72.251.232.228                        84         120           0                 1420840831

 ************ Truncated Output ************

63.140.36.121                         84         158           0                 2353775209, 1120324107
63.140.36.119                         2          158           62                2353775209, 1120324107
130.35.98.32                          80         290           0                 1120324107
63.140.36.14                          84         158           0                 2353775209, 1120324107
63.140.36.101                         84         158           6                 2353775209, 1120324107

>
Troubleshooting
Use the debug policy-route command to troubleshoot the policy based routing feature. Additionally, for troubleshooting path monitoring, use the debug path-monitoring command.
The following debug output shows the
> debug path-monitoring 255
> debug policy-route
PM_METRICS: RTT not yet ready on ifc outside
PM_METRICS: Added metrics for type 6, BID 1120324107
PM_METRICS: RTT not yet ready on ifc outside
PM_METRICS: RTT not yet ready on ifc outside
PM_METRICS: RTT not yet ready on ifc outside
PM_METRICS: RTT not yet ready on ifc outside
PM_METRICS: RTT not yet ready on ifc outside
PM_METRICS: RTT not yet ready on ifc outside
PM_METRICS: RTT not yet ready on ifc outside
PM_METRICS: RTT not yet ready on ifc outside
PM_METRICS: RTT not yet ready on ifc outside
pbr : Metrics shall be updated for dns bid 1120324107
pbr : Generating DP table for DNS BID 1120324107
pbr : DP Table, dns_bid = 1120324107 , version = 205
PM_METRICS: Added metrics for type 6, BID 1120324107
PM_METRICS: RTT not yet ready on ifc outside2
PM_METRICS: RTT not yet ready on ifc outside2
PM_METRICS: RTT not yet ready on ifc outside2
PM_METRICS: RTT not yet ready on ifc outside2
PM_METRICS: RTT not yet ready on ifc outside2
PM_METRICS: RTT not yet ready on ifc outside2
PM_METRICS: RTT not yet ready on ifc outside2
PM_METRICS: RTT not yet ready on ifc outside2
PM_METRICS: RTT not yet ready on ifc outside2
pbr : Metrics shall be updated for dns bid 1120324107

Sending http req for 63.140.36.119 webex.com q_idx 11
snp_put_http_req_to_cp: CP event enqueue succeeded, ifc 4 FMC_NSG_386547078770 webex.com
Sending http req for 63.140.36.119 webex.com q_idx 11
snp_put_http_req_to_cp: CP event enqueue succeeded, ifc 5 FMC_NSG_386547078770 webex.com

Received on ifc 4, FMC_NSG_386547078770 webex.com id 11 status 200
snp_update_pm_rtt_info 20
Received on ifc 5, FMC_NSG_386547078770 webex.com id 9 status 5
Count 0 bid 1120324107

Sending http req for 63.140.36.119 webex.com q_idx 12
snp_put_http_req_to_cp: CP event enqueue succeeded, ifc 2 FMC_NSG_386547078770 webex.com

Received on ifc 2, FMC_NSG_386547078770 webex.com id 12 status 200
snp_update_pm_rtt_info 1

Sending http req for 63.140.36.119 webex.com q_idx 12
snp_put_http_req_to_cp: CP event enqueue succeeded, ifc 4 FMC_NSG_386547078770 webex.com
Sending http req for 63.140.36.119 webex.com q_idx 12
snp_put_http_req_to_cp: CP event enqueue succeeded, ifc 5 FMC_NSG_386547078770 webex.com

Received on ifc 4, FMC_NSG_386547078770 webex.com id 12 status 200
snp_update_pm_rtt_info 20
Received on ifc 5, FMC_NSG_386547078770 webex.com id 10 status 5


pbr: route map FMC_GENERATED_PBR_1697180863502, sequence 5, permit; proceed with policy routing
pbr : Number of dns_bid_t returned for dest addr 63.140.36.101 : 2
pbr : Looking up DP table for dns bid 2353775209
pbr : Looking up DP table for dns bid 1120324107
pbr : DP table 0x0000150b06915140 found for dns bid 1120324107
pbr: Ingress ifc inside, PBR adaptive traffic forward for dest 63.140.36.101, egress-ifc outside2 nh 198.19.40.64
Ingress ifc inside, For traffic [198.19.11.225->63.140.36.101], PBR picked outside2 as its jitter metrics became better than outside
pbr: policy based routing applied; egress_ifc = outside2 : next_hop = 198.19.40.64
>
Limitations
- This feature is not available on cluster deployments.
- With this release, the probe URL cannot be configured.
- Threat defense currently supports monitoring over IPv4 addresses only.
Additional Resources
To learn more about PBR using HTTP based application monitoring, please refer to the following links:
Updated over 2 years ago