Scenario 6 - SD-WAN Summary Dashboard
Cisco Secure Firewall Release 7.4 introduced the SD-WAN summary dashboard that provides a holistic view of WAN devices and their associated interfaces in the deployment and aids in identifying issues related to devices and network paths that help network administrators take prompt recovery measures.
The dashboard provides network administrators with the following:
- A single dashboard that consolidates information from WAN devices e.g. device health, interface connectivity, application throughput, and VPN connectivity
- Ability to diagnose issues related to underlay and overlay (VPN) topologies
- Quick cross-launch that helps in faster troubleshooting for issues related to device health, device management, and VPNs
- Increasing uptime by continuous monitoring of links and prompt recovery measures
Note
For the data to be populated correctly on the SD-WAN summary dashboard, a WAN device must meet one of the following criteria:
• The device is a VPN peer, or
• The device has an interface with path monitoring enabled, or
• The device has an egress interface that is monitored for at least one application in a PBR policy.Additionally, a WAN interface must meet one of the following criteria:
• An interface with path based monitoring enabled on it, or
• An interface having a PBR policy with at least one application monitoring it
Warning
Some of the data in the dashboard is populated based on the tasks completed in the VRF support for DVTI using the SD-WAN Wizard lab scenario. Please make sure to complete that lab first before proceeding with this lab.
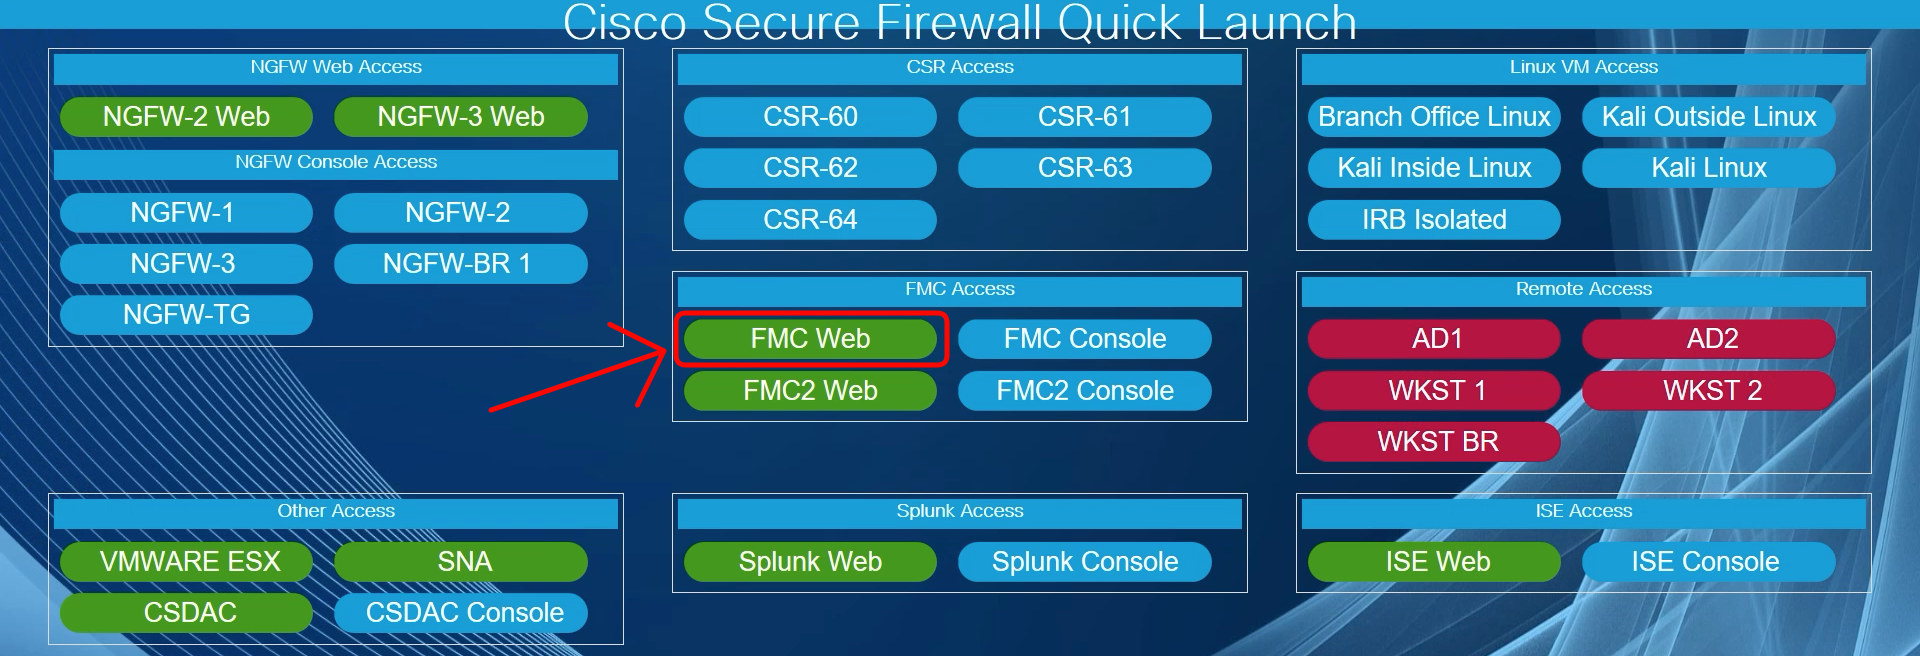
- Using the Quick Launch or the Google Chrome browser connect to the FMC web UI.
Login as admin/C1sco12345. These credentials should be pre-populated in the browser.
-
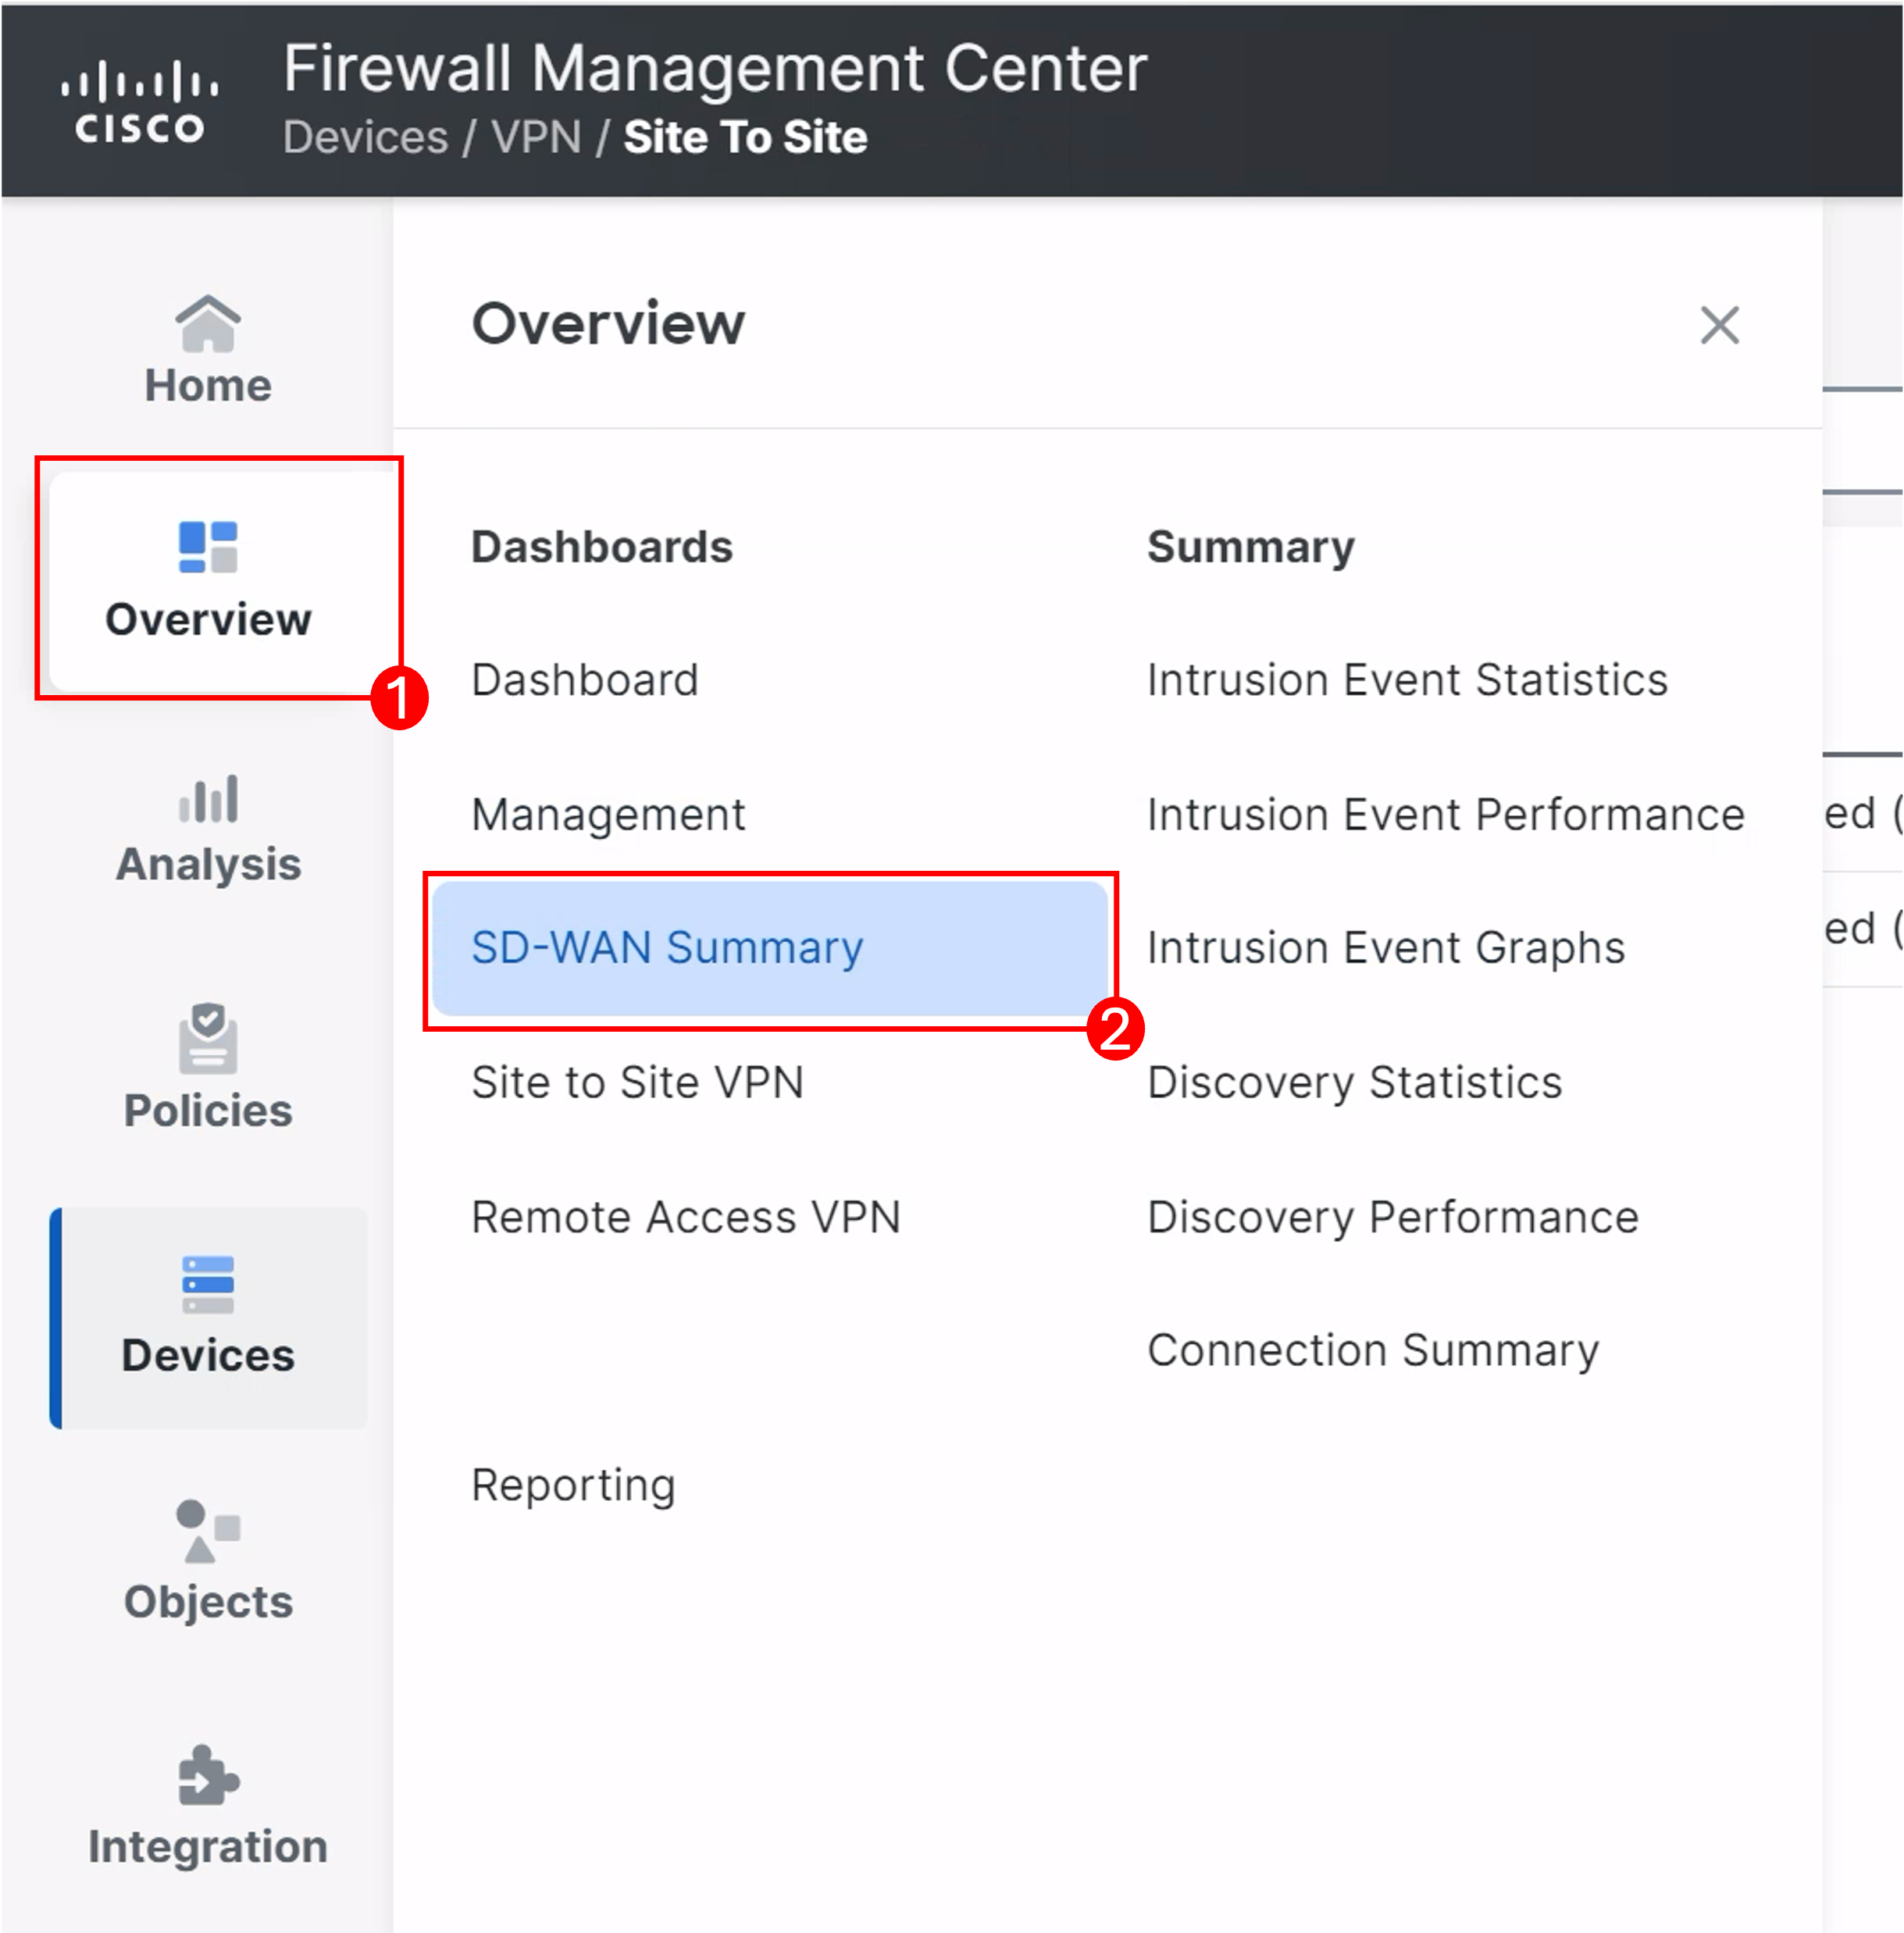
Navigate to Overview > SD-WAN Summary to view the dashboard.
-
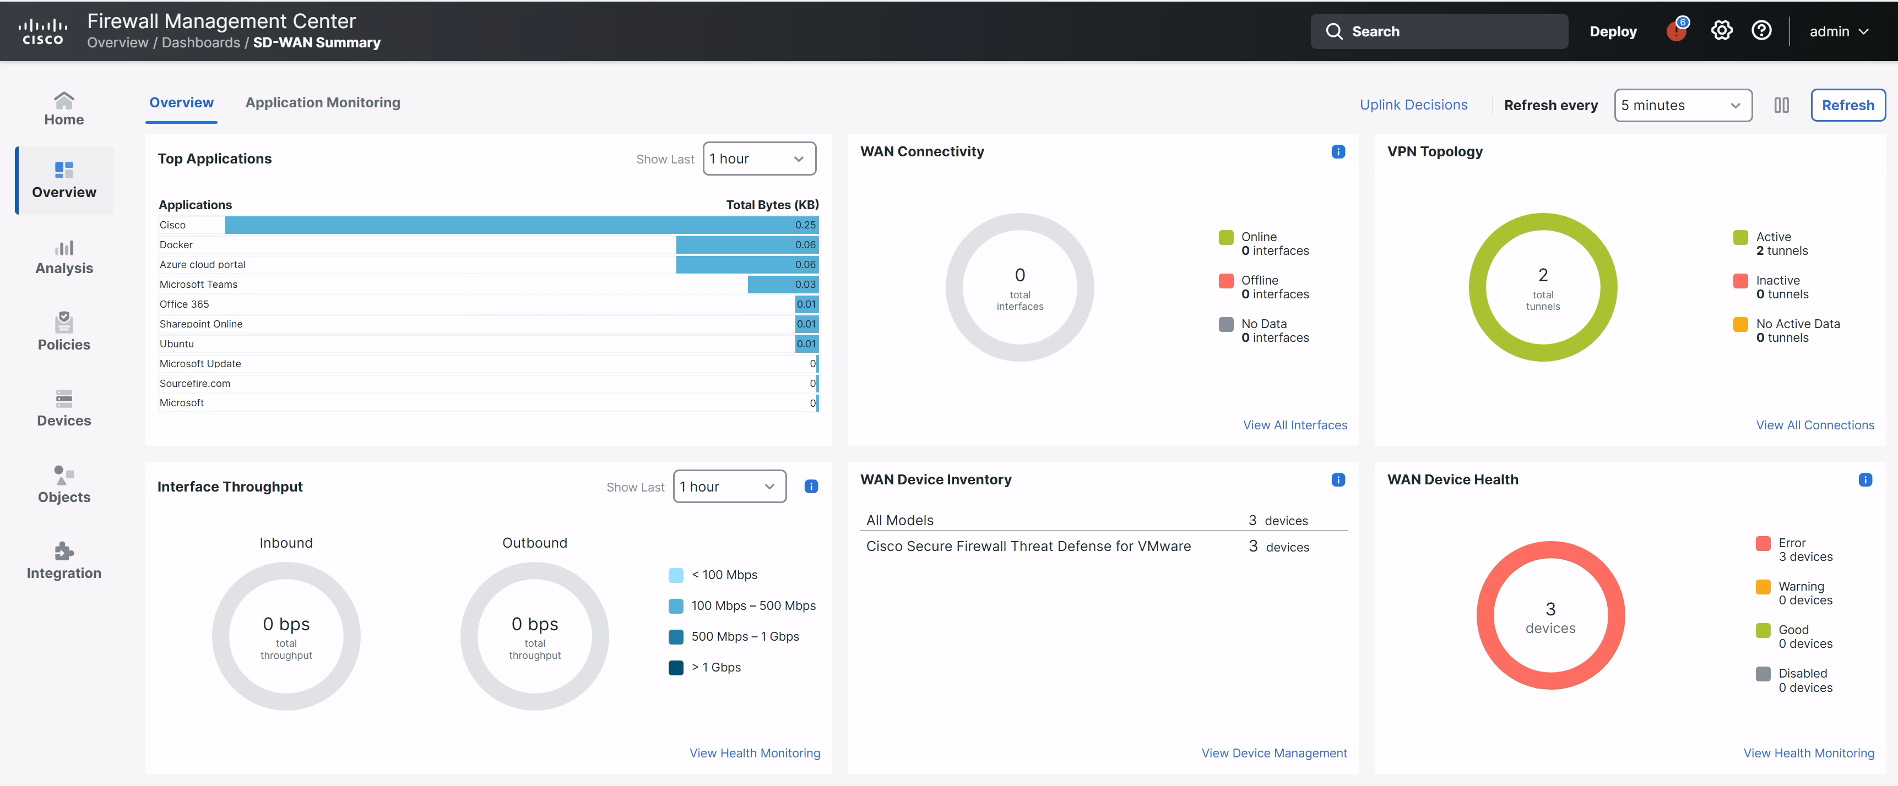
This opens the SD-WAN Summary Dashboard where you can view things like Device Inventory, Device Health, and VPN Topologies:
-
Next, we will need enable path monitoring on the outside interface of all three firewalls so that the WAN Connectivity widget can begin populating data. To do that, first navigate to Devices > Device Management and click the pencil (edit) icon next to NGFW1.
-
Click the pencil (edit) icon next to Gigabitethernet0/0
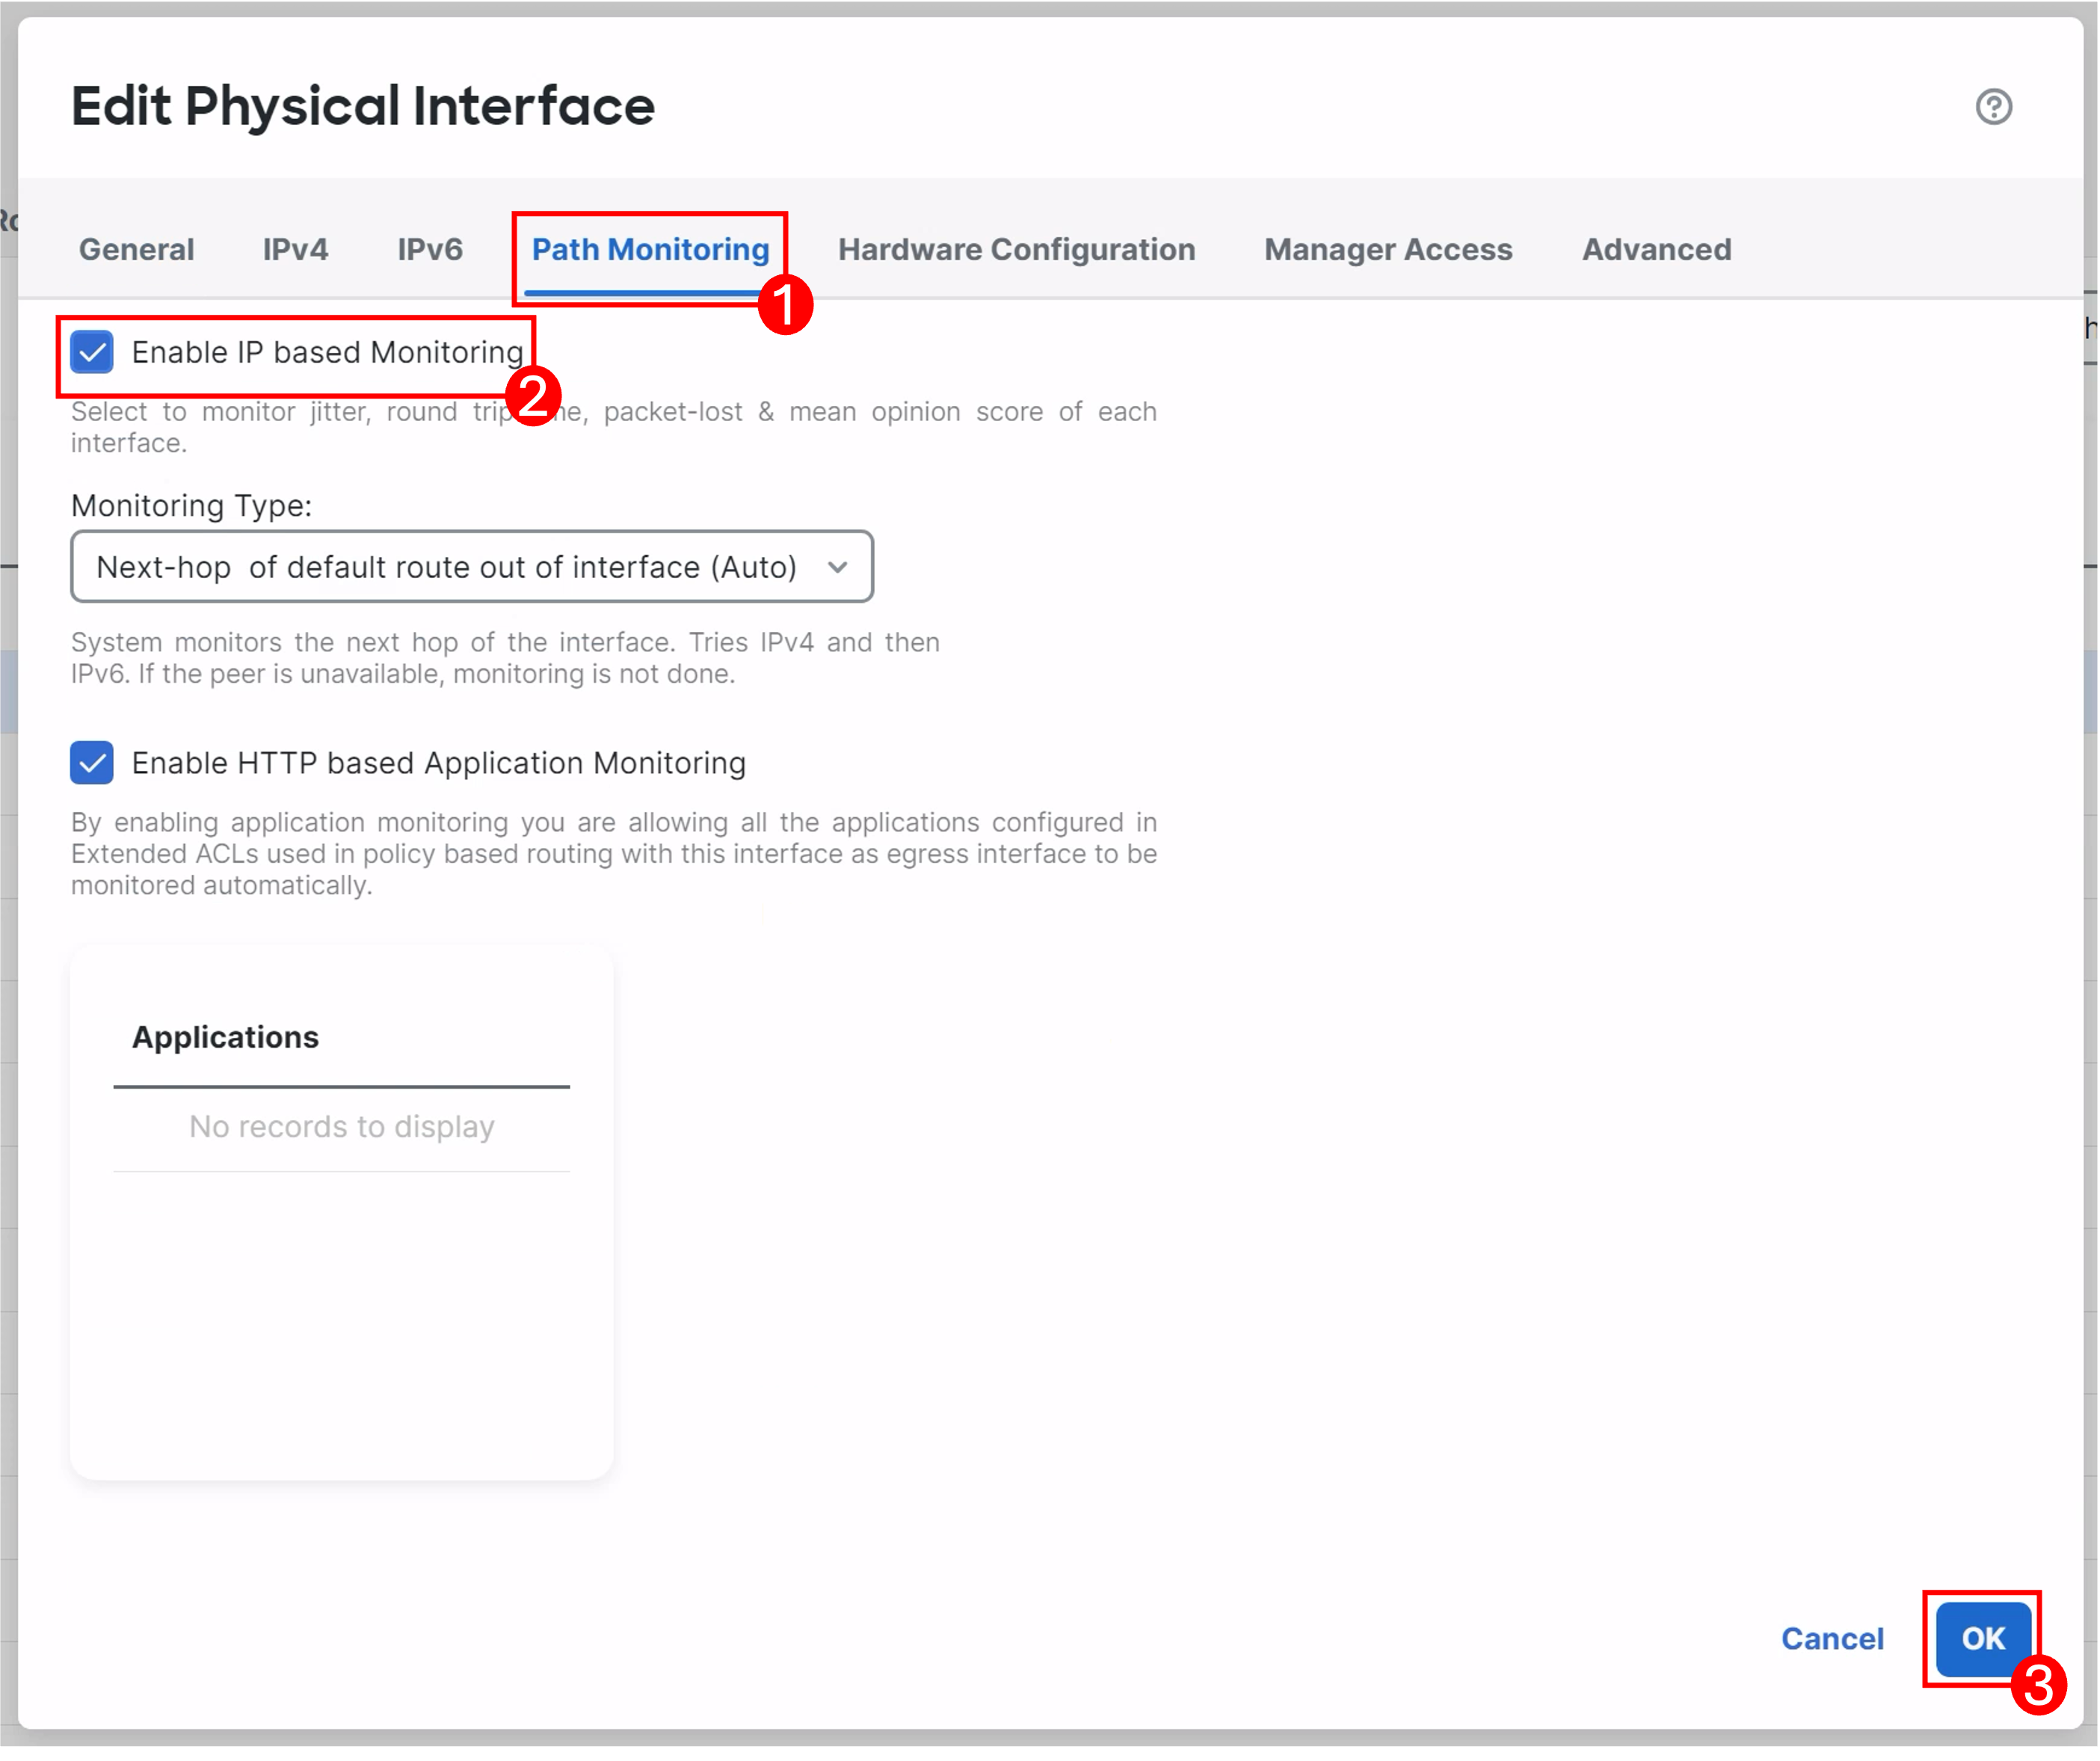
- Click the Path Monitoring tab and check the box next to Enable IP based monitoring.
- Click OK.
-
Click Save to save the interface settings.
Important
Repeat steps 4 - 6 onNGFW2 and NGFW3 to enable Path Monitoring.
-
Push the new interface settings to NGFW1 NGFW2 and NGFW3 by navigating to and selecting Deploy > Deploy All. Wait for the deployment to complete before moving forward.
-
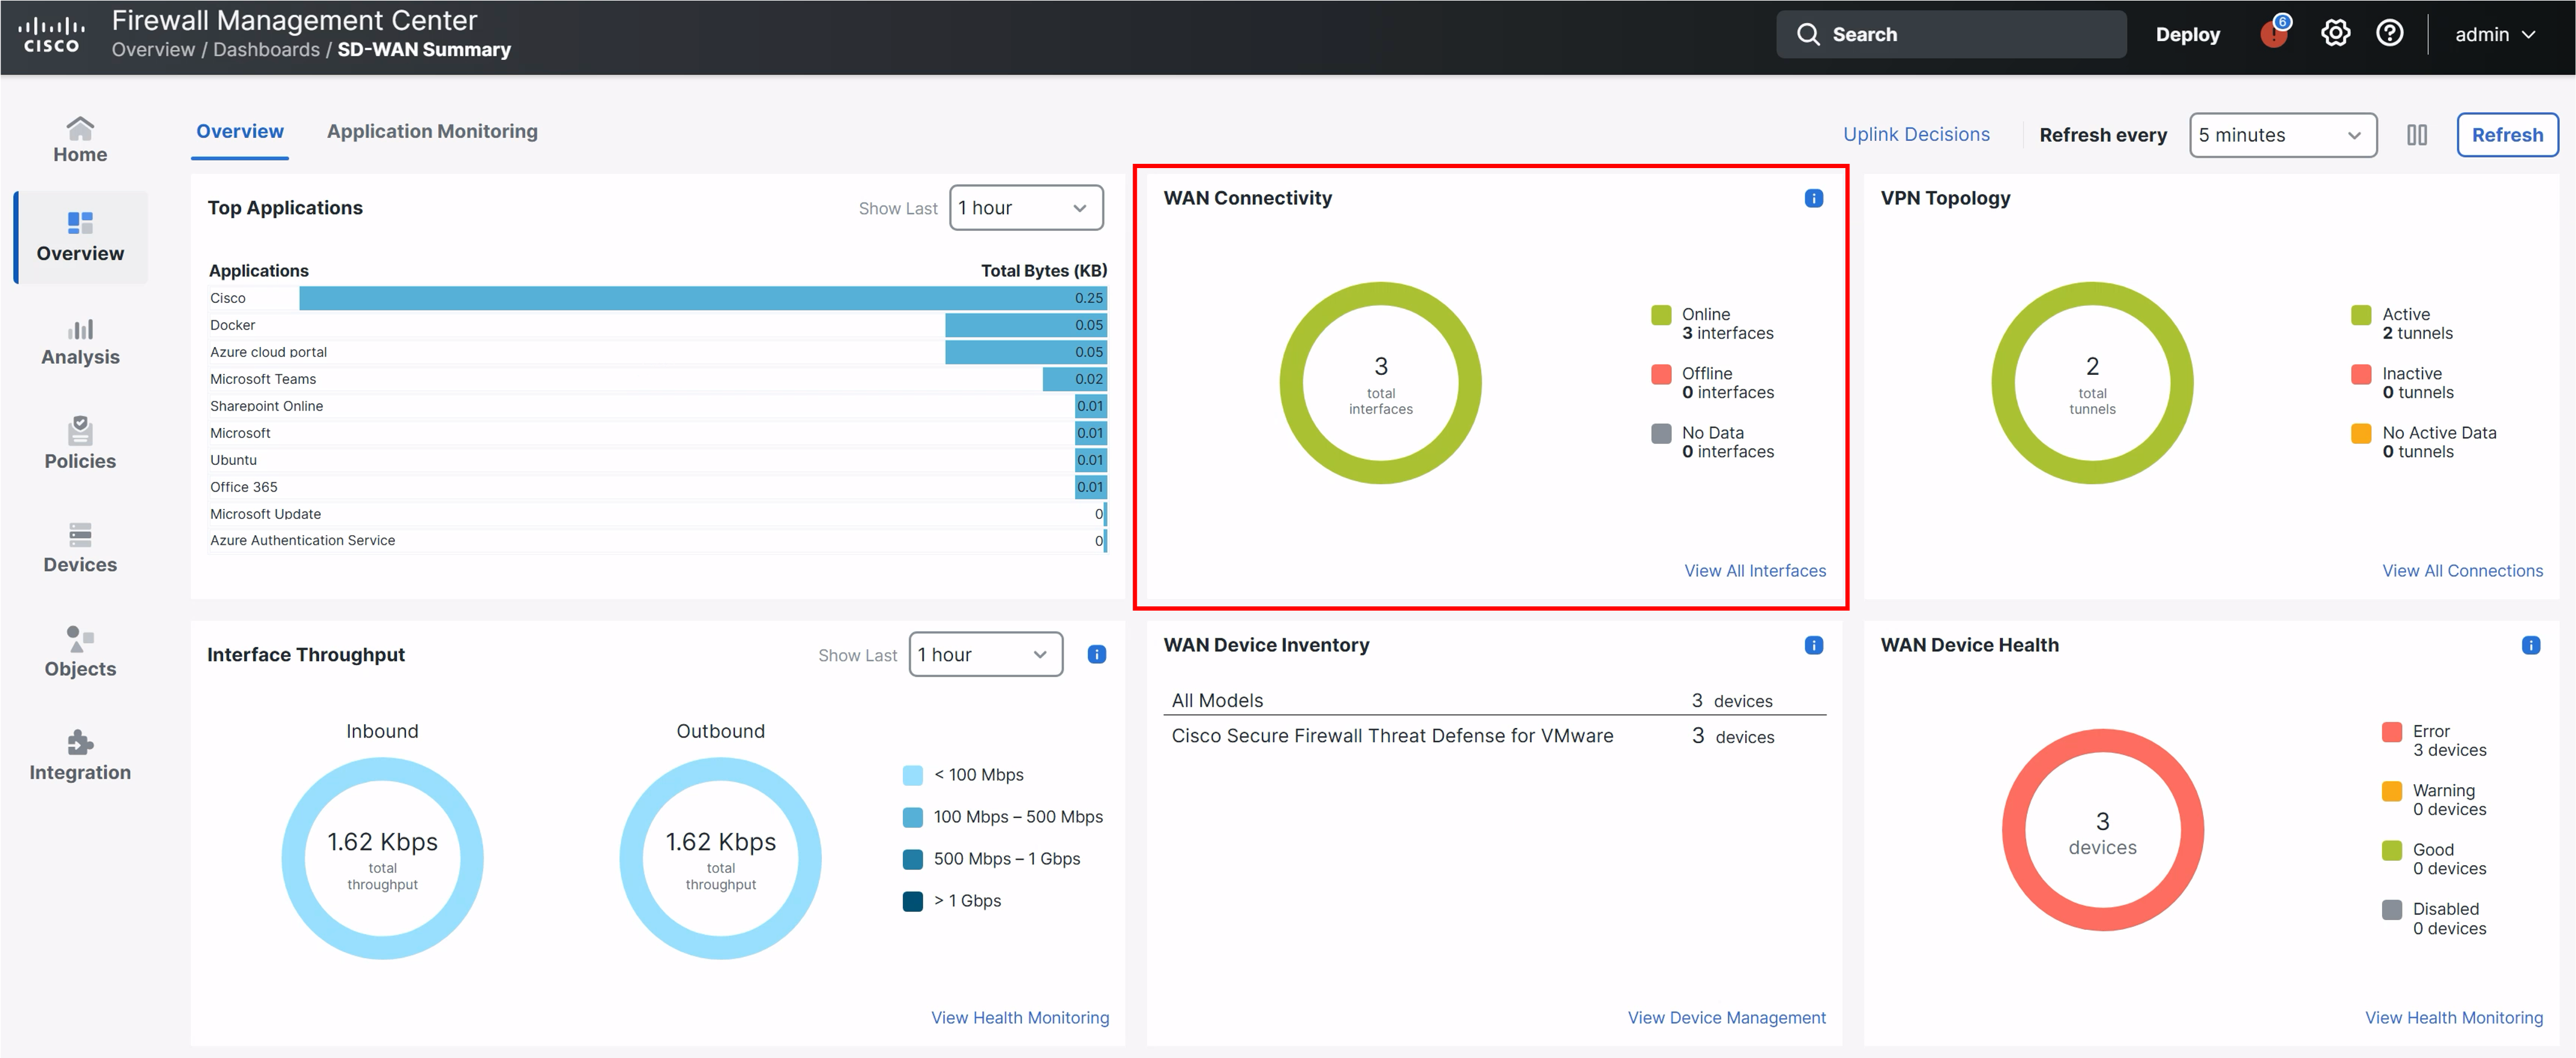
Head back to the SD-WAN dashboard, now you should see three devices in the WAN Connectivity widget.
Note
It may take up to five minutes for the updated status to reflect in the dashboard.
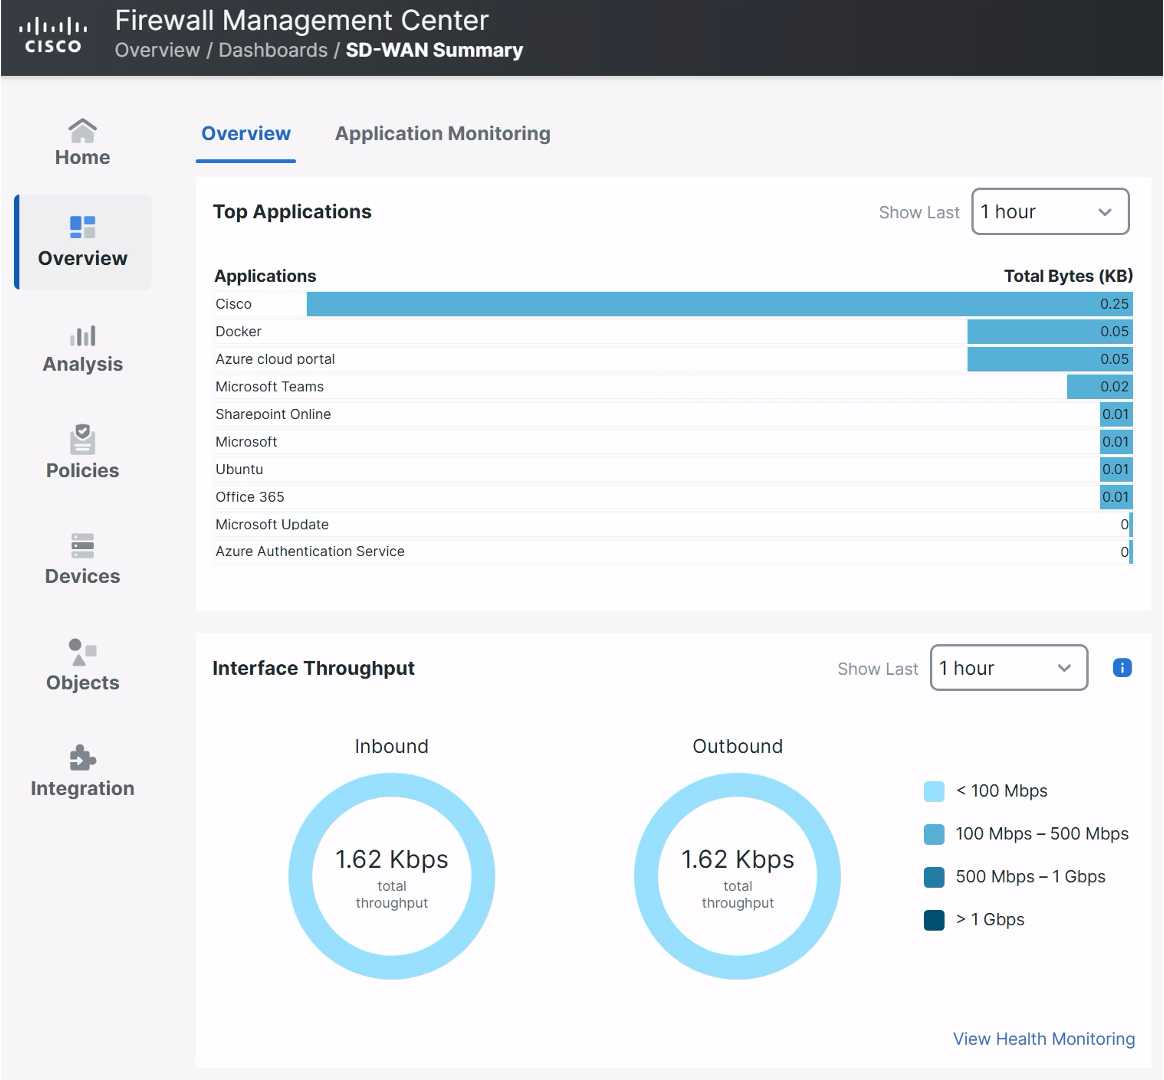
- We can also monitor top applications and interface throughput widgets to see which applications are consuming the most bandwidth in the network, as well as which interfaces are transferring the most traffic.
Note
Interface status health check should be enabled in the applied health policy for interface throughput information to reflect correctly.
Success
This concludes the SD-WAN Summary Dashboard lab. In the next scenario we will view more specific tunnel statistics we configured in the previous scenario.
📚Additional Resources
To learn more about the SD-WAN Summary Dashboard, please refer to the following guide:
https://secure.cisco.com/secure-firewall/docs/sd-wan-summary-dashboard
Tell us how we are doing
We are doing our best to ensure the scenarios in this lab guides are useful, clear and work as expected.
Please share your thoughts to help us improve or fix any problems you may run into..
Click here to provide your feedback or report an issue with this guide
Updated over 1 year ago

