Policy Based Routing (PBR)
Cisco Internal Use Only for Secure Firewall Roadshow Ignite Event
Scenario
In this lab activity, you will learn how to configure and validate Direct Internet Access (DIA) with Policy-Based Routing and leverage path monitoring for optimum path selection. Cisco Secure Firewall version 7.1 introduced the Direct Internet Access (DIA) feature, where you can now configure policy-based routing through the FMC to classify network traffic based on applications and to implement Direct Internet Access (DIA) to send traffic to the Internet. You can define a PBR policy and configure it on ingress interfaces, specifying match criteria and egress interfaces. Network traffic that matches the access control policy is forwarded through the egress interface based on priority or order as configured in the policy.
With version 7.2, Cisco Secure Firewall also supports path monitoring for Policy-Based Routing. PBR uses path monitoring to collect the performance metrics (RTT, jitter, packet-lost, and MOS) of the egress interfaces and then uses these metrics to determine the best path (egress interface) for forwarding the traffic. Path monitoring periodically notifies PBR about the monitored interfaces if in case the metrics change. Effectively, PBR retrieves the latest metric values for the monitored interfaces from the path monitoring database to allow the traffic via the most optimum path.
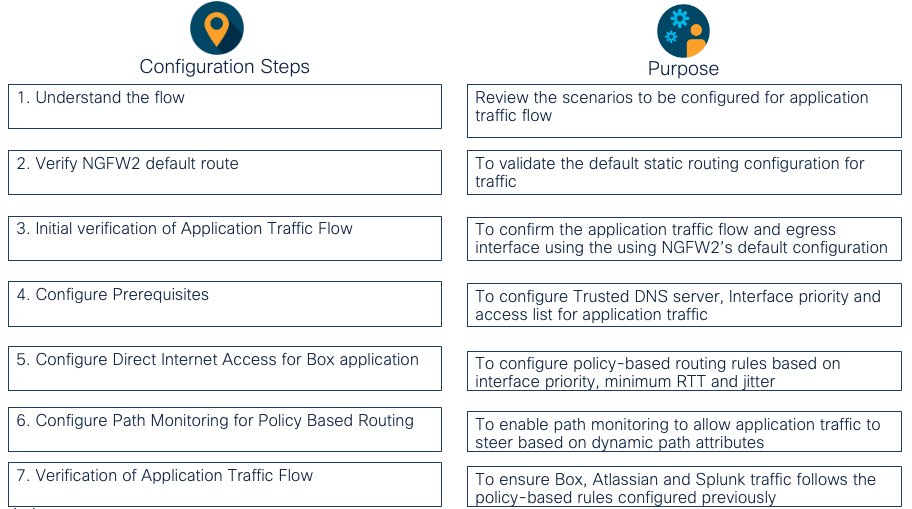
Lab Tasks
- Task 1: Understand the lab flow
- Task 2: Verify NGFW2 default route.
- Task 3: Initial Verification of applications traffic flow
- Task 4: Configure Prerequisites
- Task 5: Configure Direct Internet Access with Policy Based Routing for Box application
- Task 6: Configure Path Monitoring for Policy Based Routing
- Task 7: Verification of Applications Traffic Flow
Learning Objectives
Upon completion of this lab, you will be able to:
- Configure Direct Internet Access (DIA) with Policy Based Routing on Cisco Secure Firewall for various applications.
- Verify that application traffic is routed to the desired path based on configured application aware routing rules.
- Validate path monitoring feature to ensure the traffic is sent via optimum path using real time metrics of monitored interface
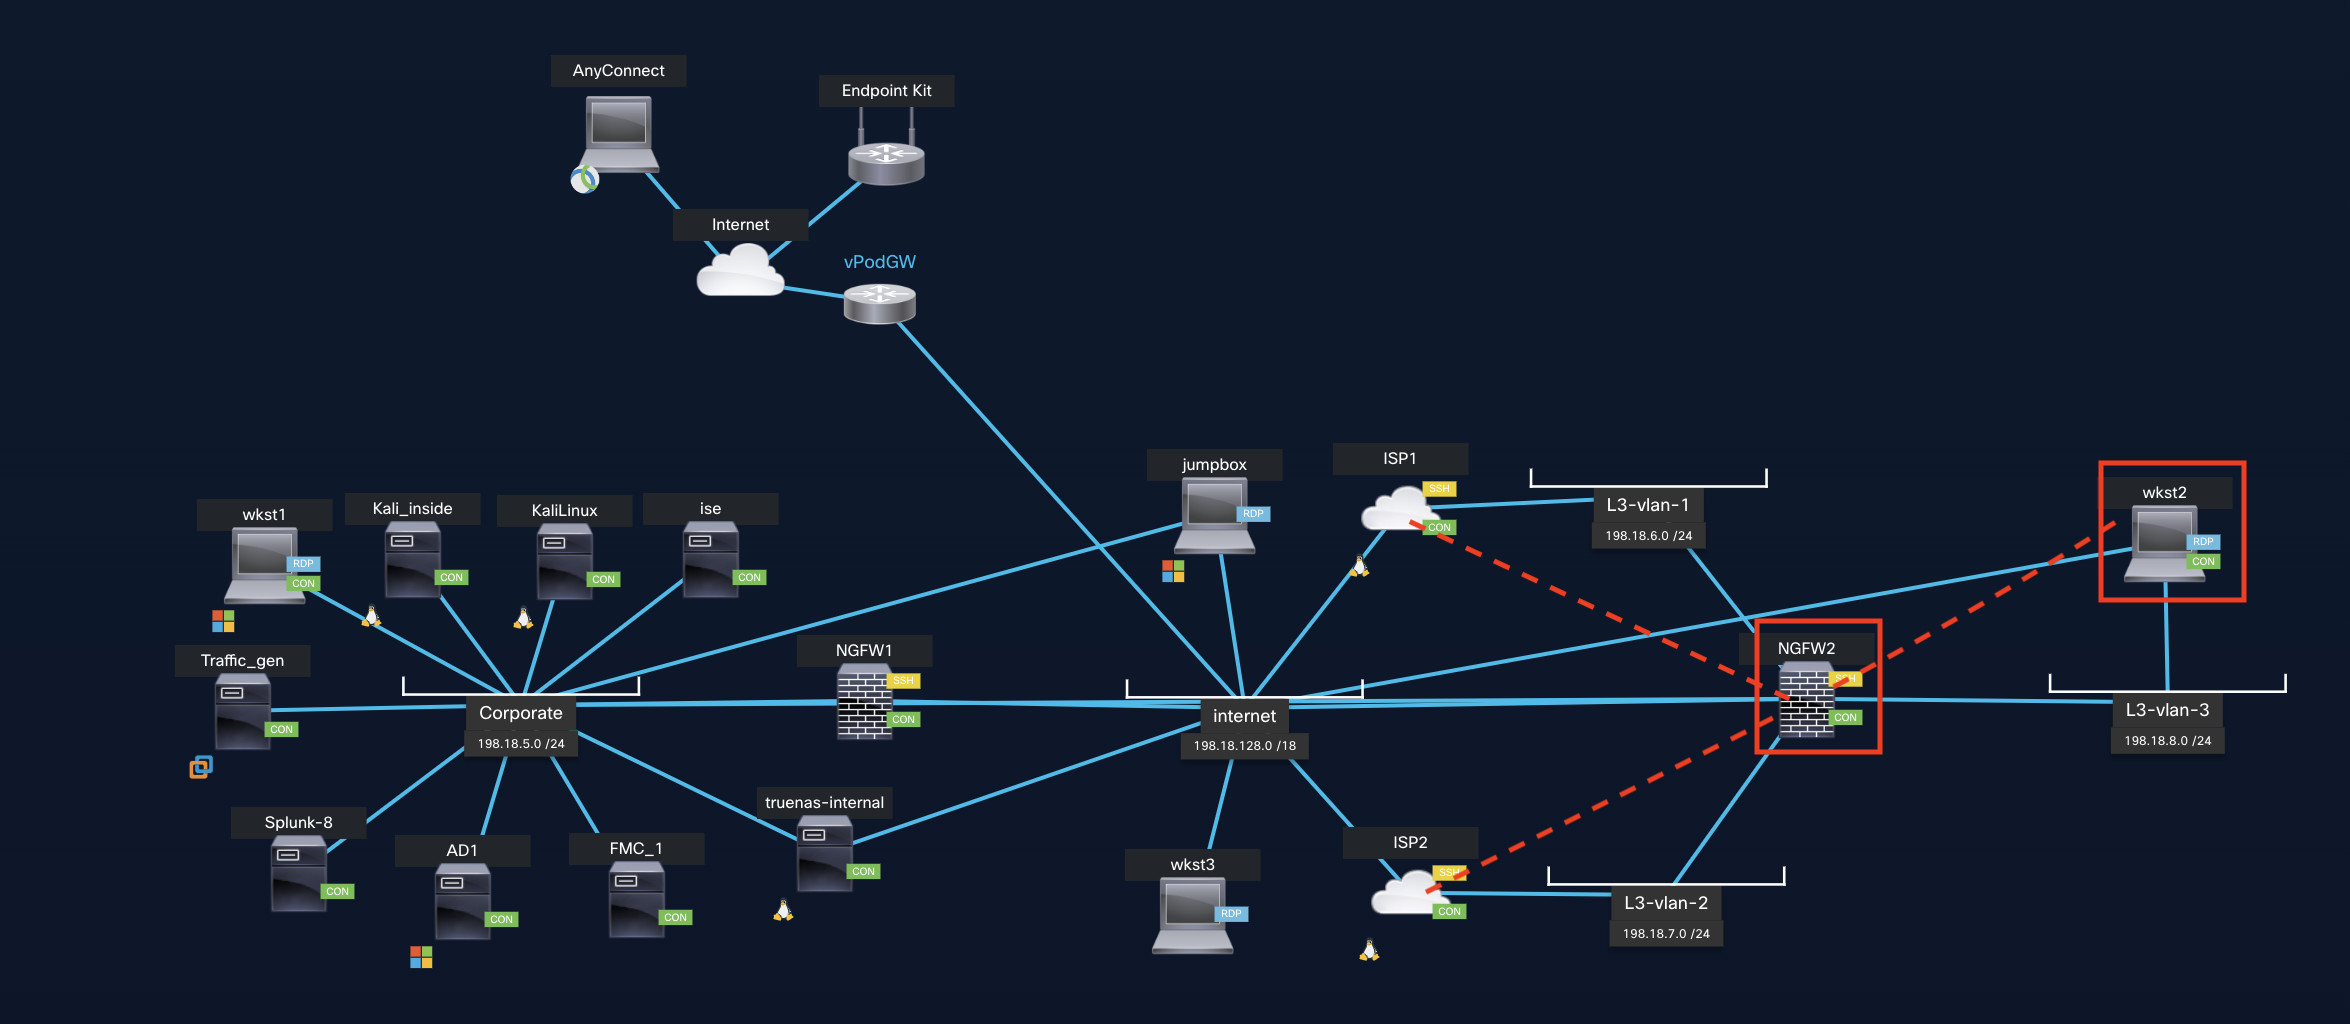
Topology
Lab Tasks Overview
Task 1: Understand the lab flow
In this lab, we have 3 scenarios.
-
Configure policy-based routing based on Interface Priority for the Box application and verify that the box application traffic will always choose the less priority egress interface.
Note:
Cisco secure Firewall uses Interface Priority to determine the optimal internet path. Priority,lower the better, determines the preference of particular ISP when sending the traffic out to the internet.
-
Configure path monitoring (IP based monitoring) for policy-based routing based on minimal round-trip time for Atlassian application and verify that the Atlassian application traffic will always choose the egress interface which has lowest round-trip time(rtt).
-
Configure path monitoring (HTTP based application monitoring) for policy-based routing based on minimal jitter for Splunk appplication and verify that the Splunk application traffic will always choose the egress interface which has lowest jitter value.
Note:
Names/ IP addresses may differ in lab guide compared to lab setup. Please reach out to your proctor if you have any questions.
Task 2: Verify NGFW2 default route
In this task, let's verify the default route configuration of the NGFW2.
- In the FMC webpage, click Devices > Device Management.
- Click on the pencil icon of NGFW2.

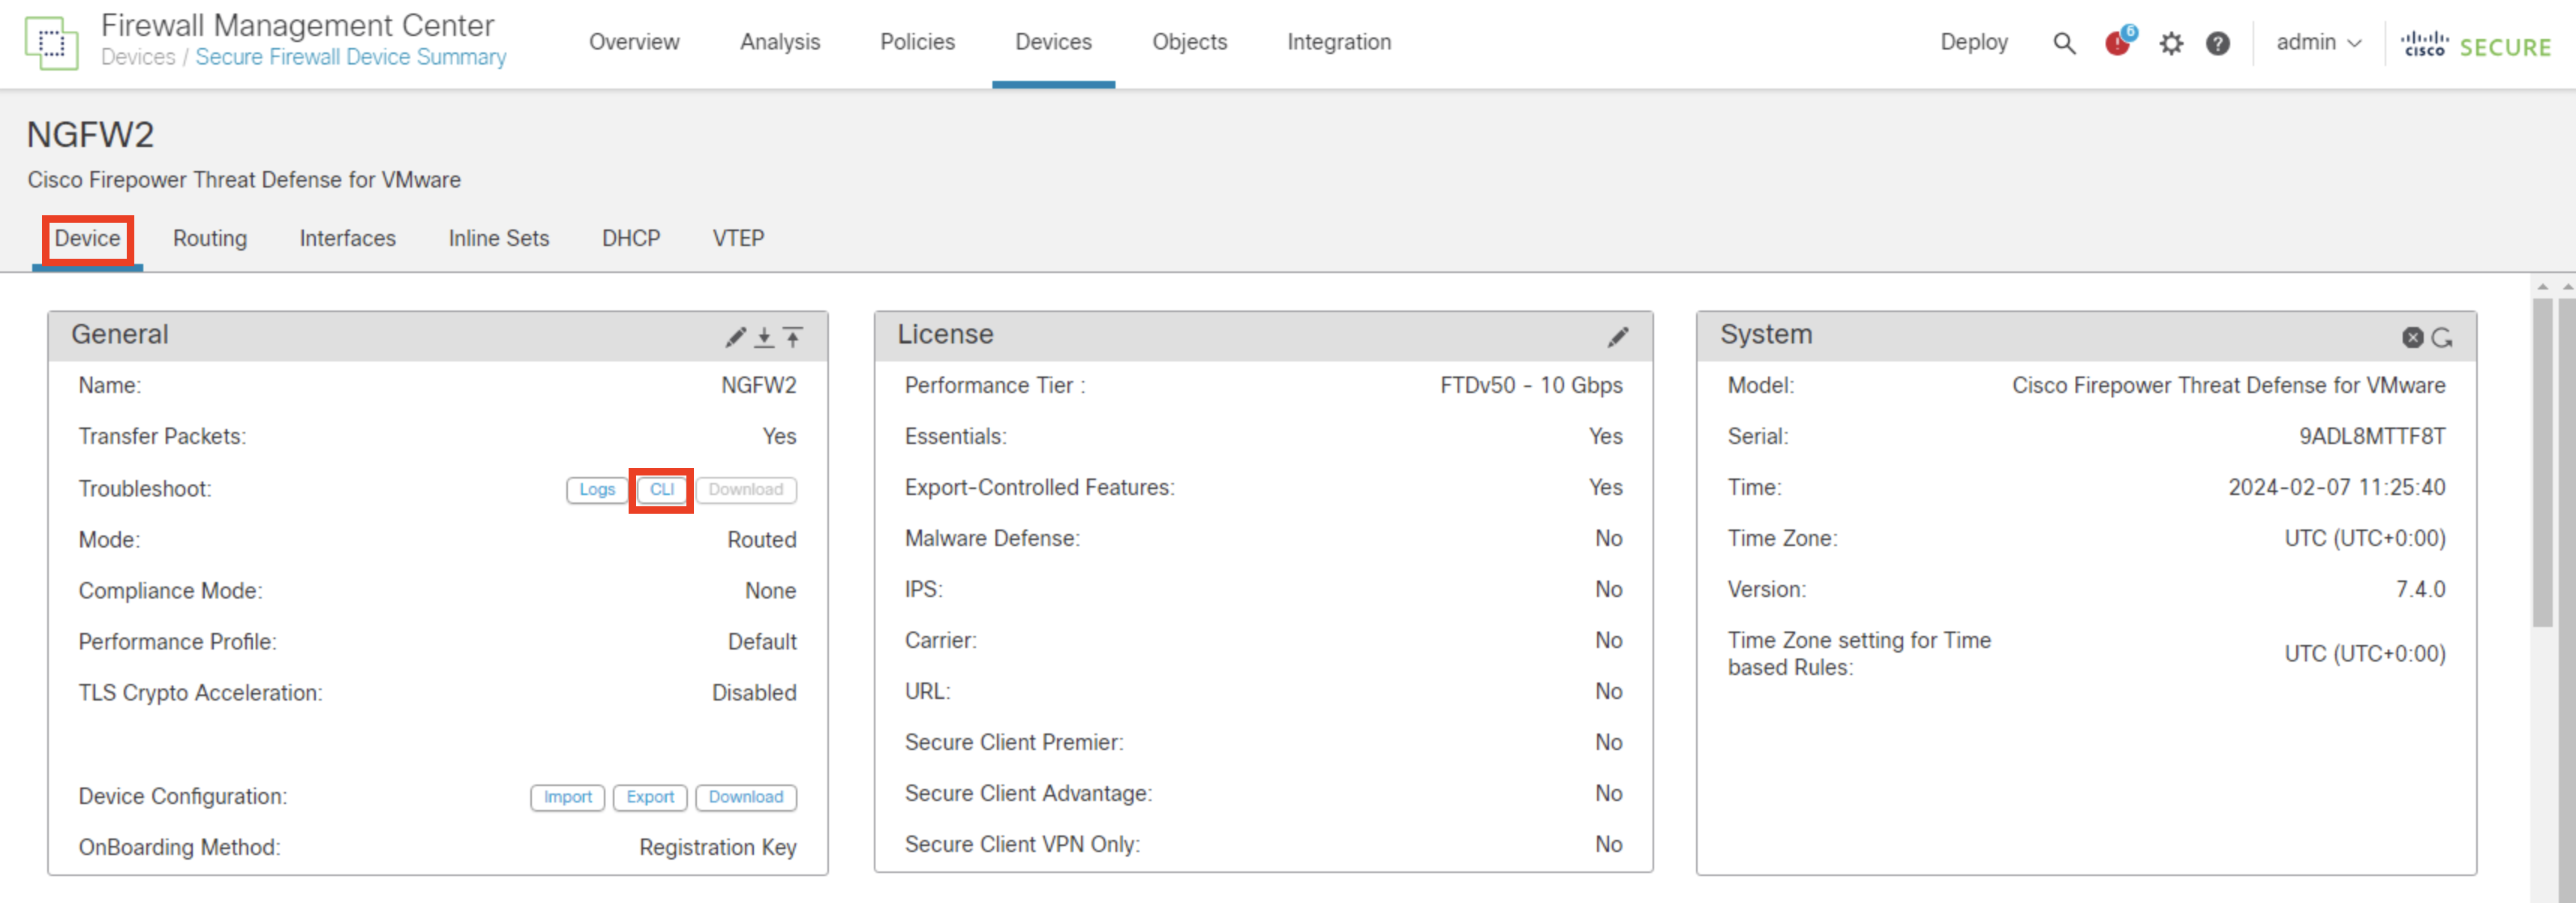
- Click on the Device tab on top to see the complete information about the device.
- In General > Troubleshoot > CLI.
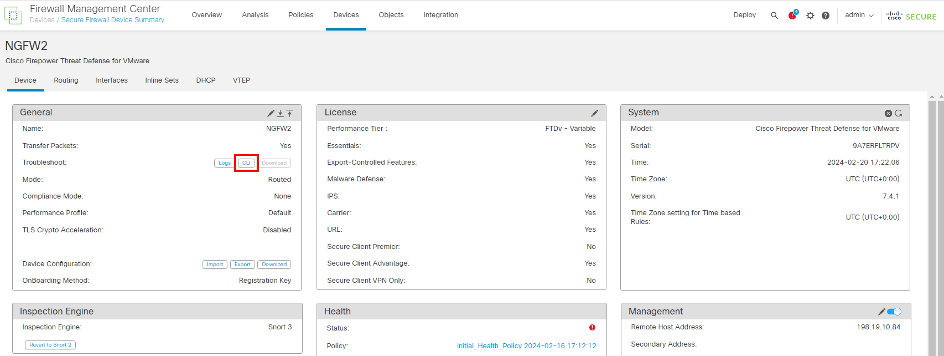
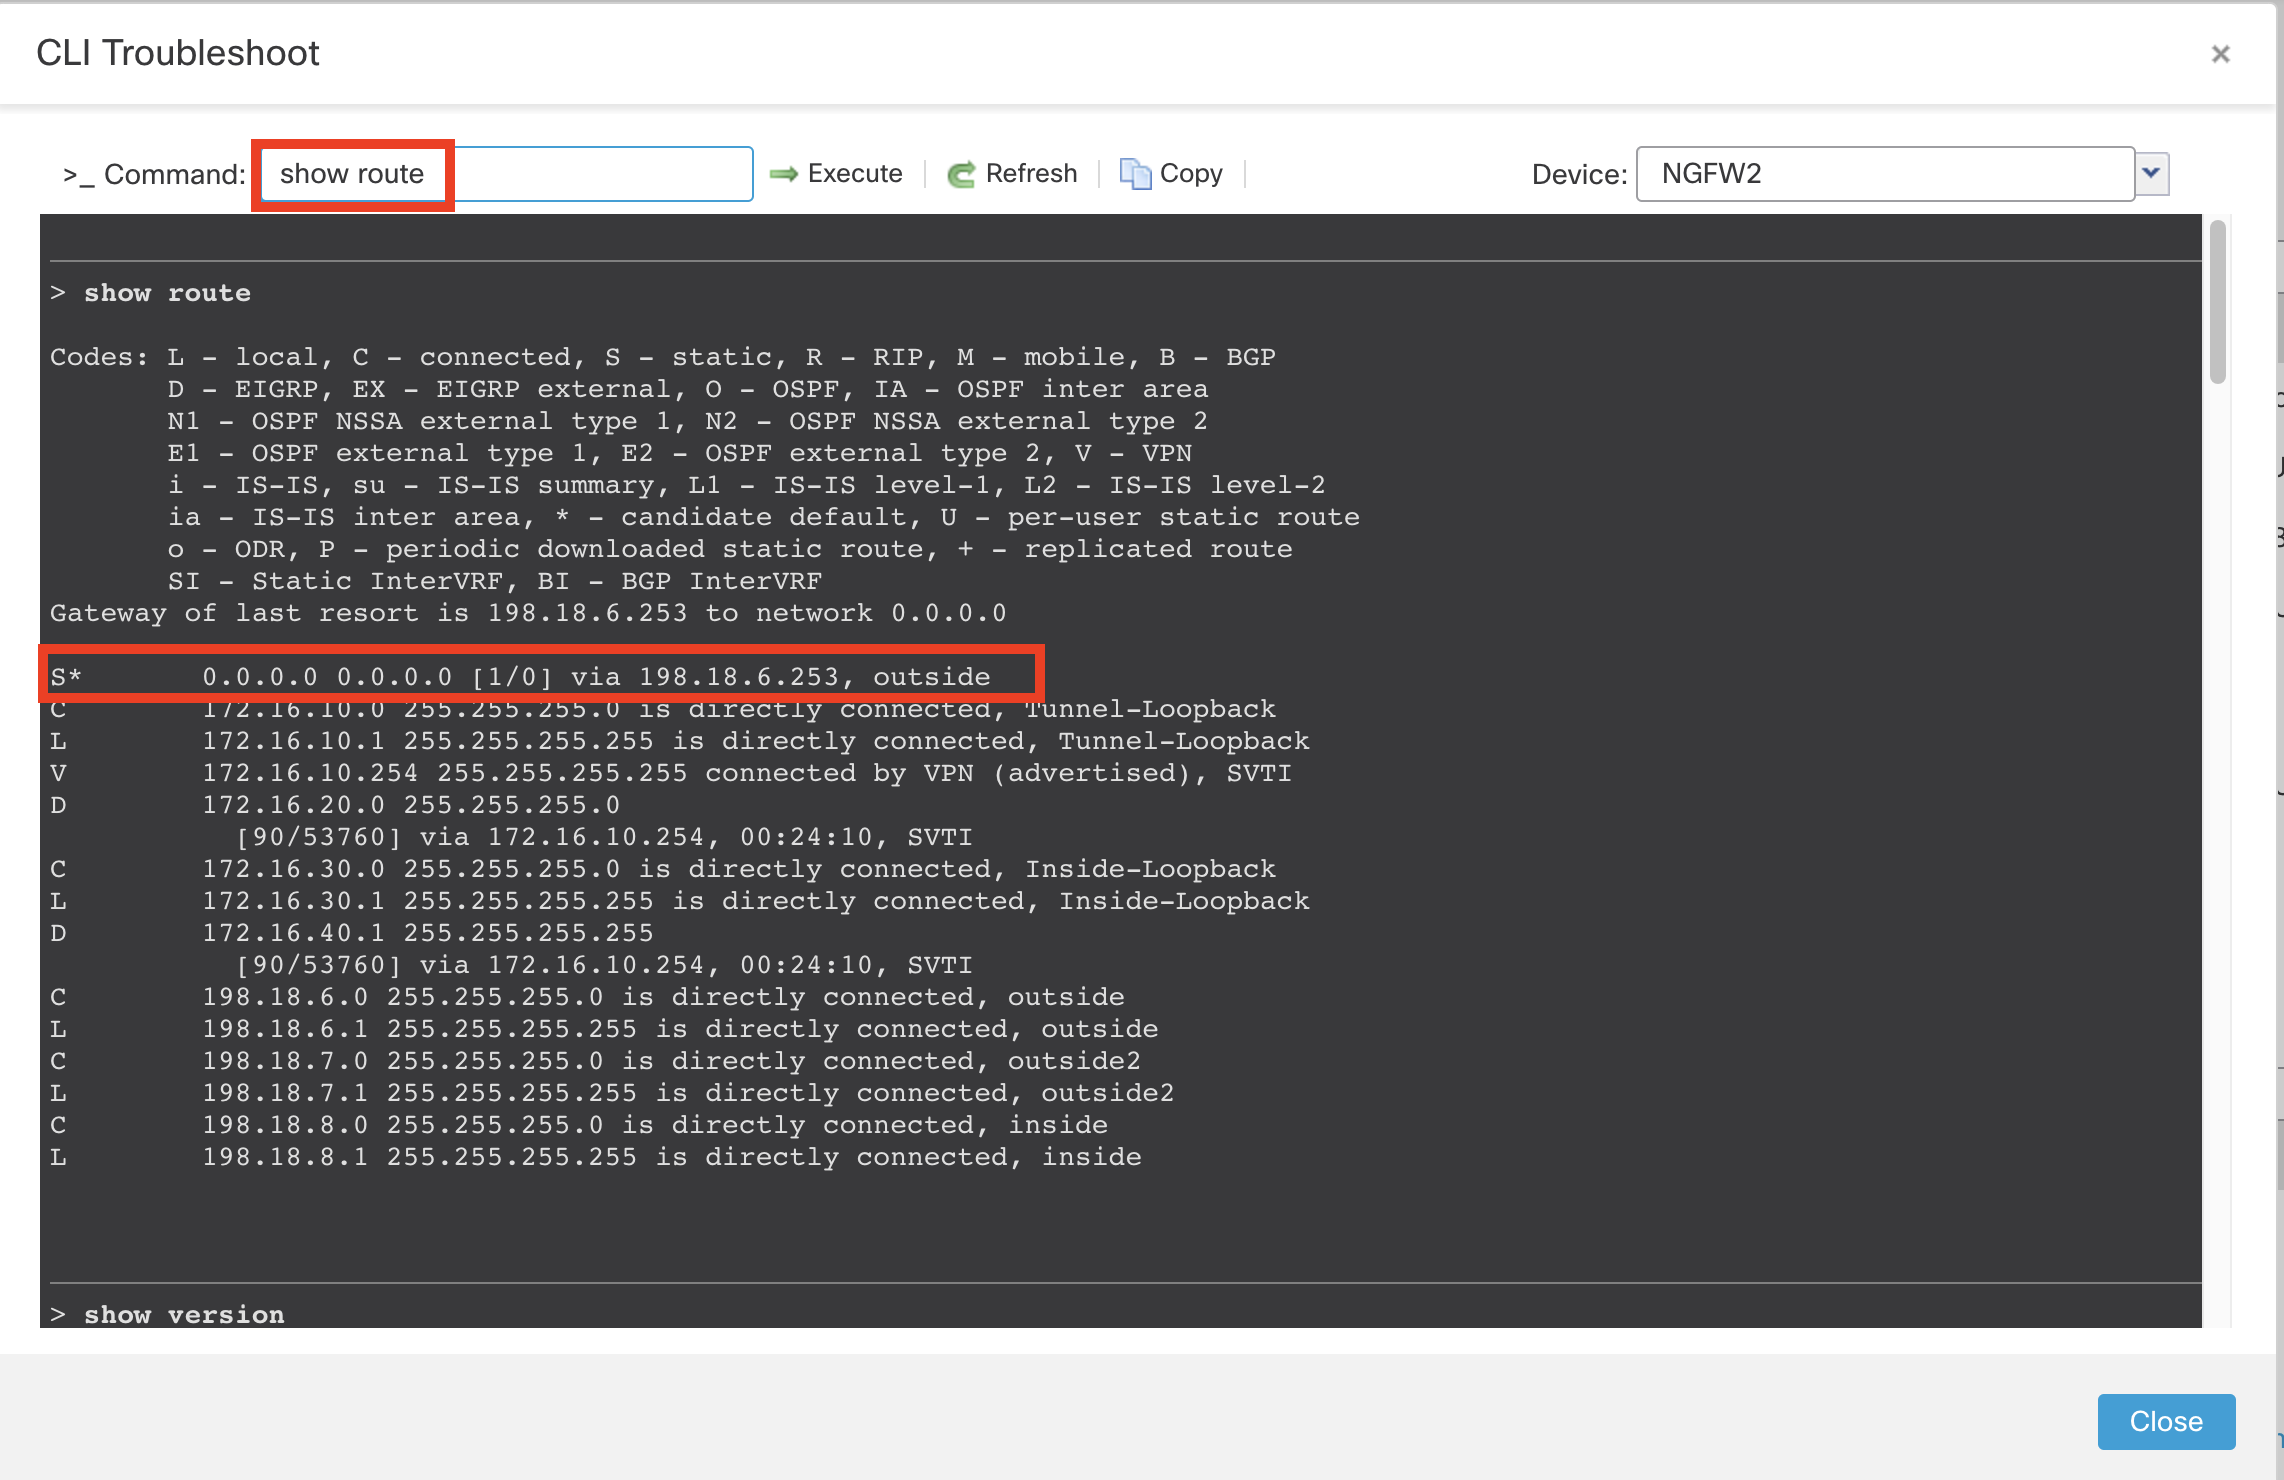
- Type show route in the text box as shown below and click on Execute and observe that the default route is pointing to outside interface.
Context:
The Default route is through the outside interface, so the traffic that is generated from wkst2 will go through the outside interface by default.
Task 3: Initial Verification of applications traffic flow
Step 1: Access wkst2 machine
We will use wkst2 to generate the traffic. To access wkst2 machine.
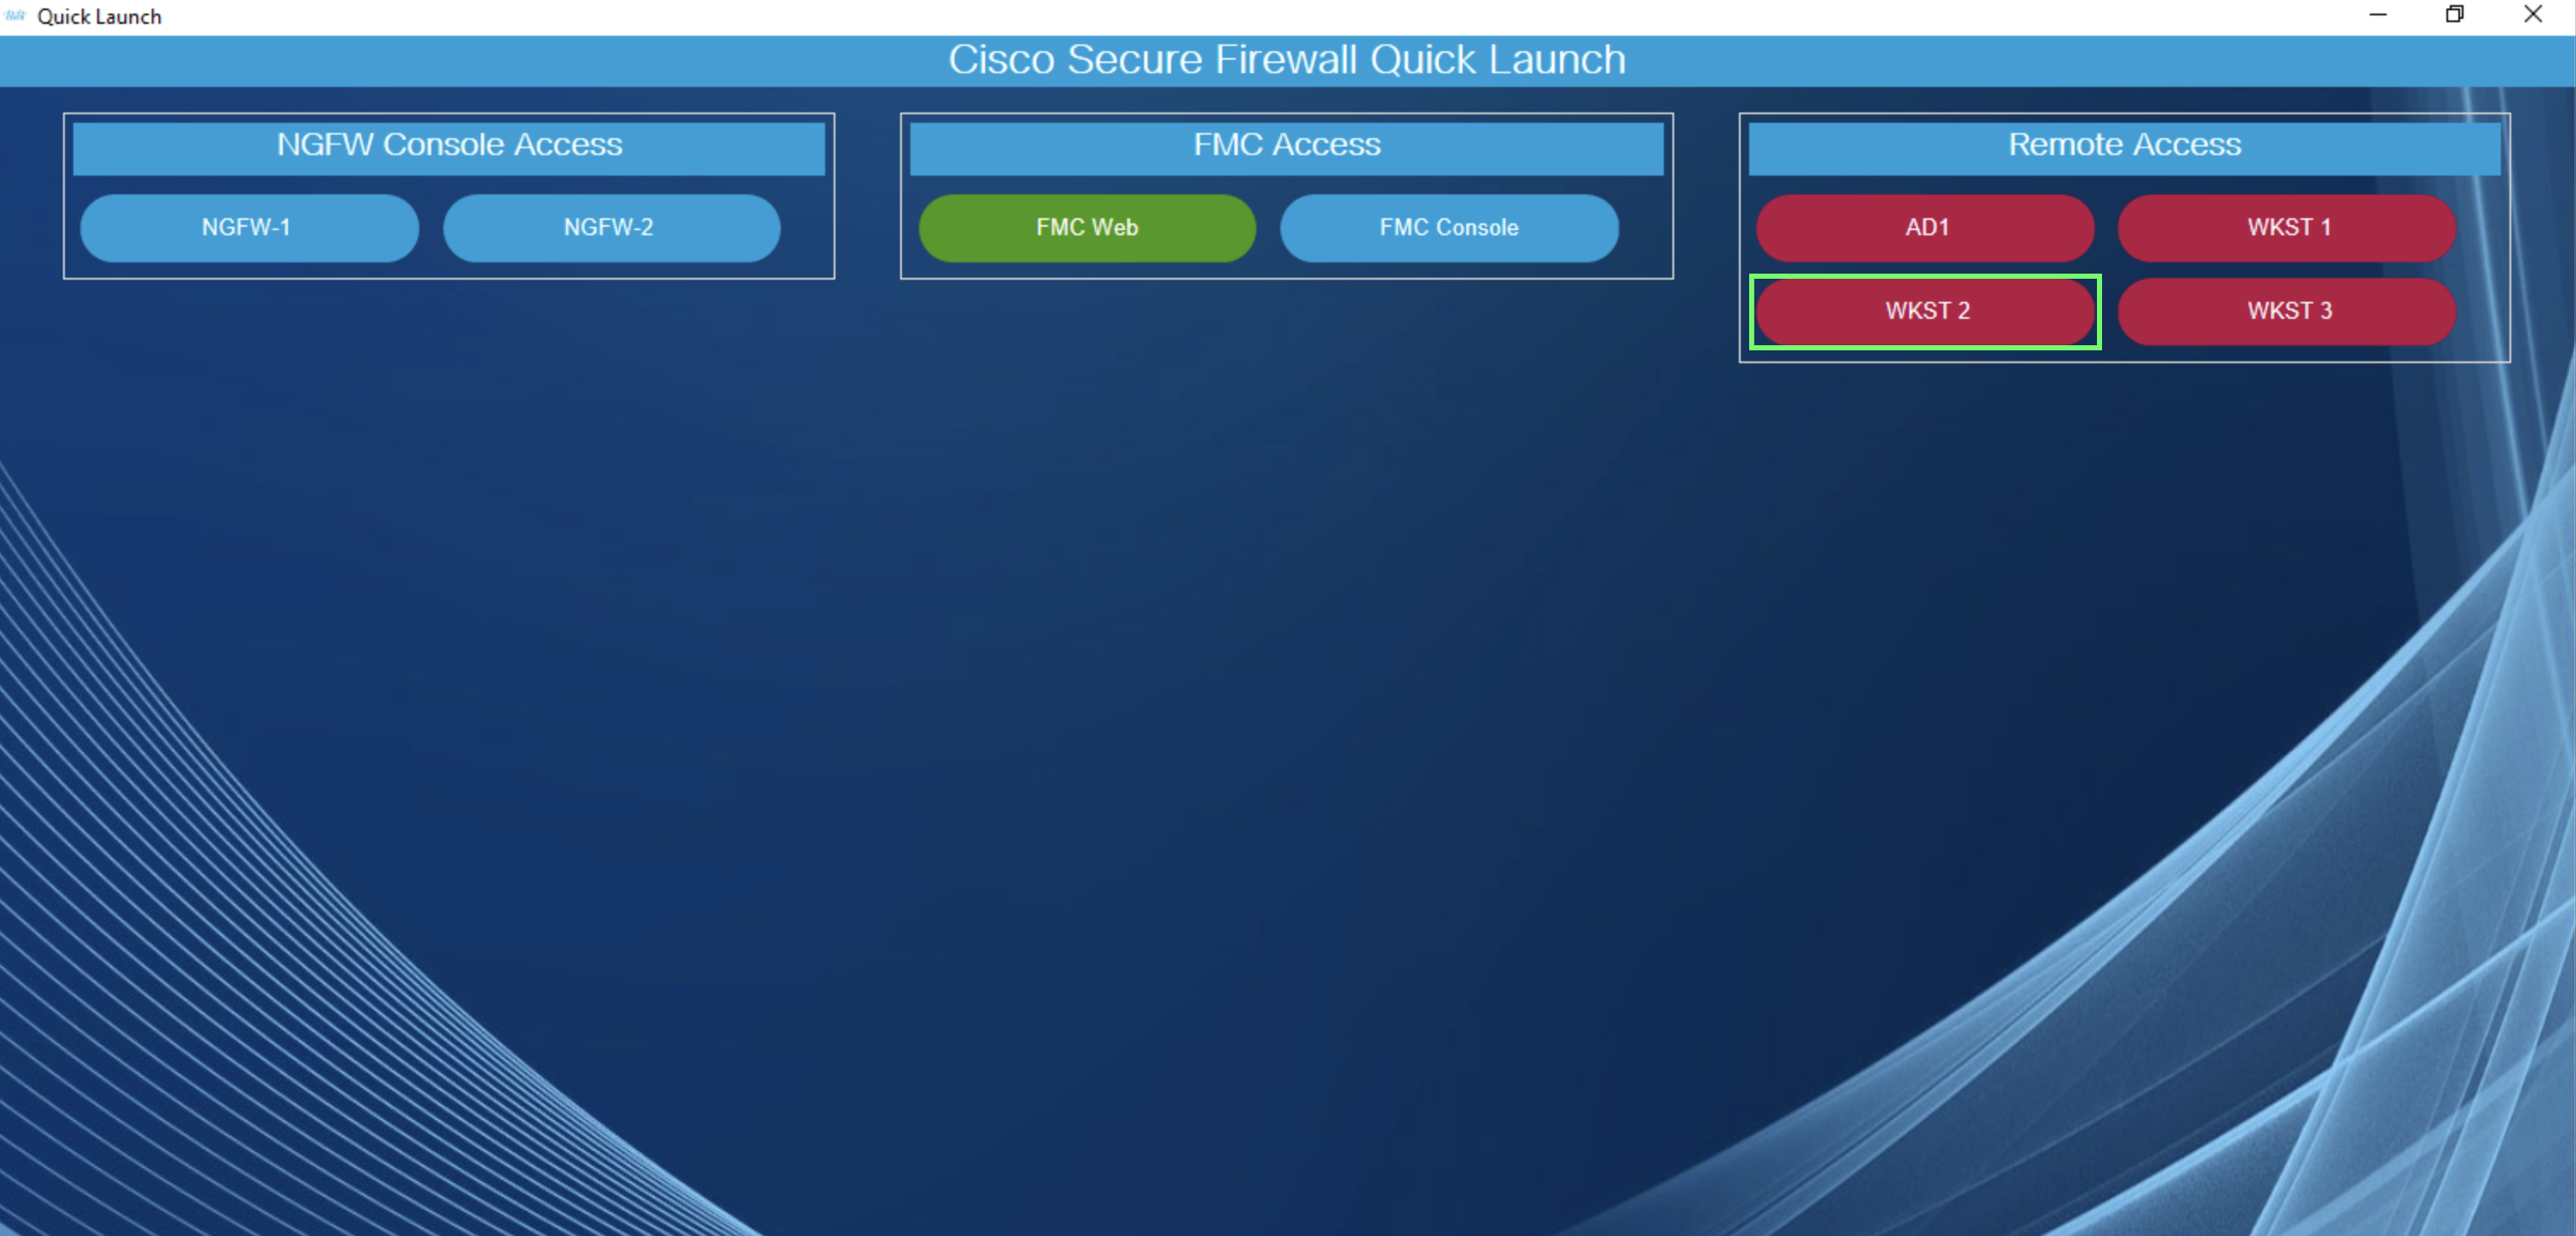
- Go to jumpbox and open Quick Launch
- Click on wkst2 machine (Password: C1sco12345)
Step 2: Generate Traffic from WKST2
In this task, generate Box, Atlassian, Splunk applications traffic from wkst2 and observe the egress interface through which the traffic is going to internet.To do that follow below steps:
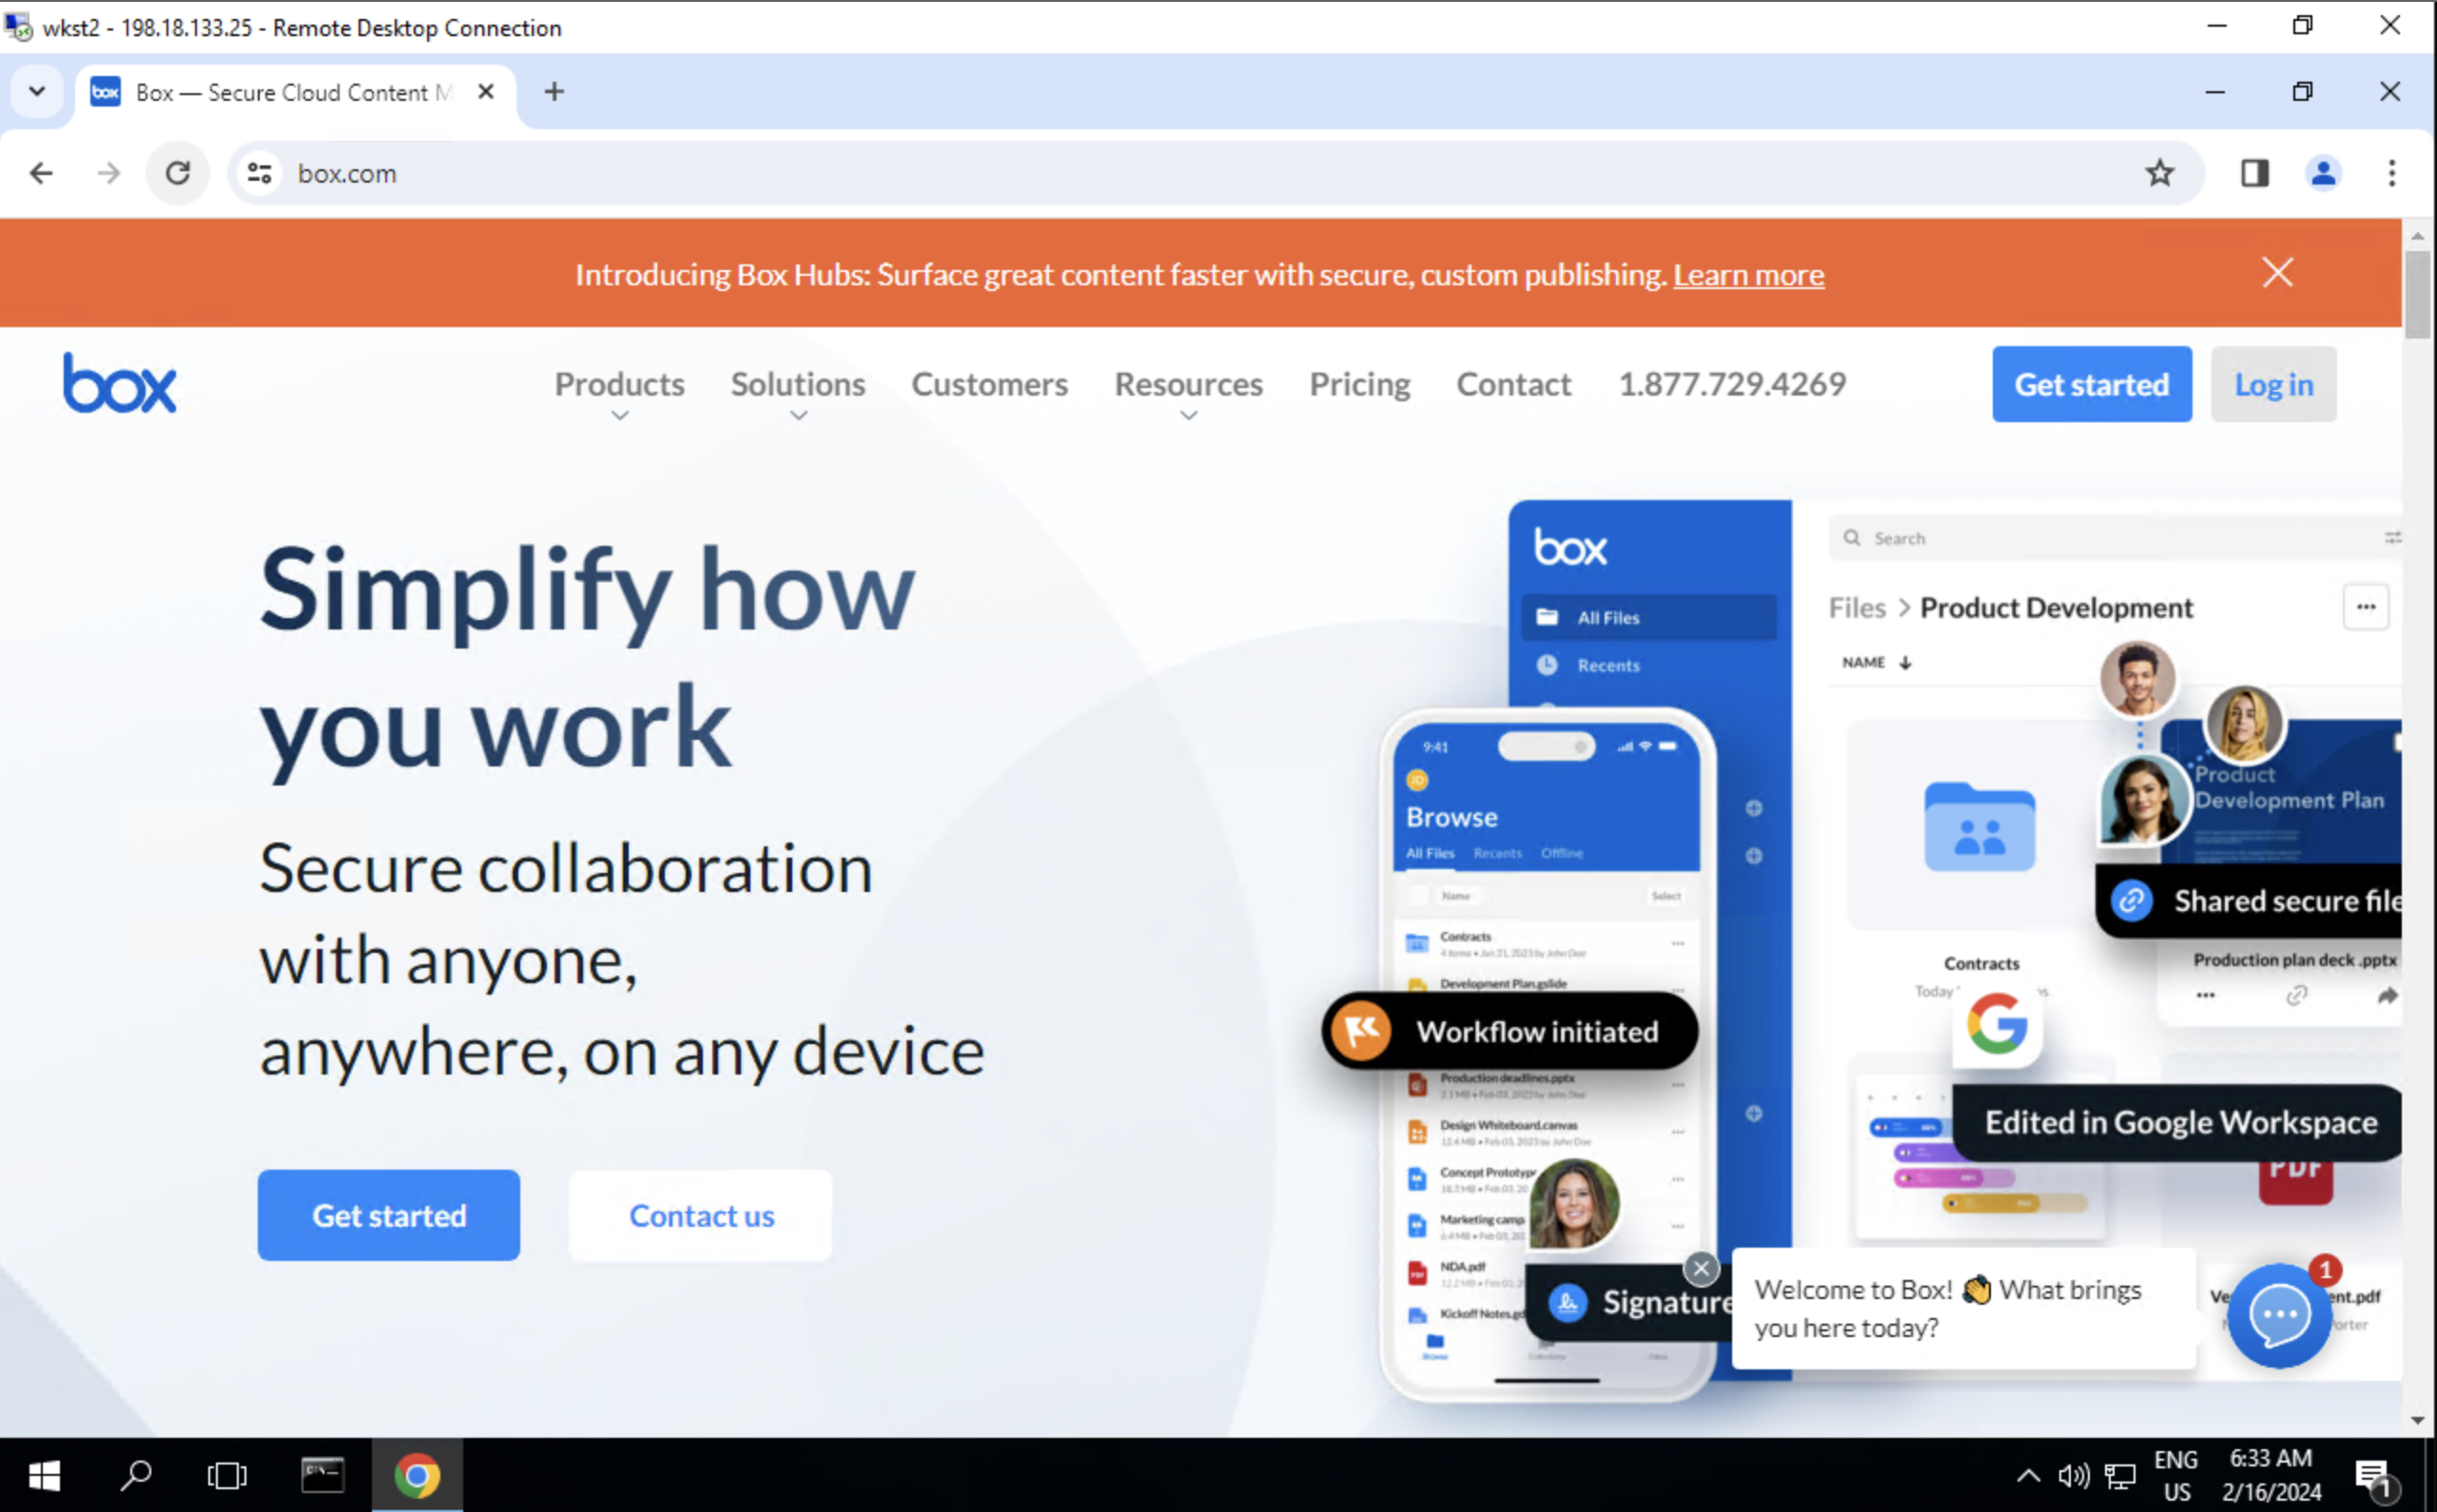
- On wkst2, launch Chrome and navigate to https://box.com for Box application traffic and confirm the website is accessible.
Note
If you are using the Firefox web browser, make sure to use HTTPS in the URL. Because Firefox, by default, uses HTTP and we are not allowing HTTP in our Access Control Policy.
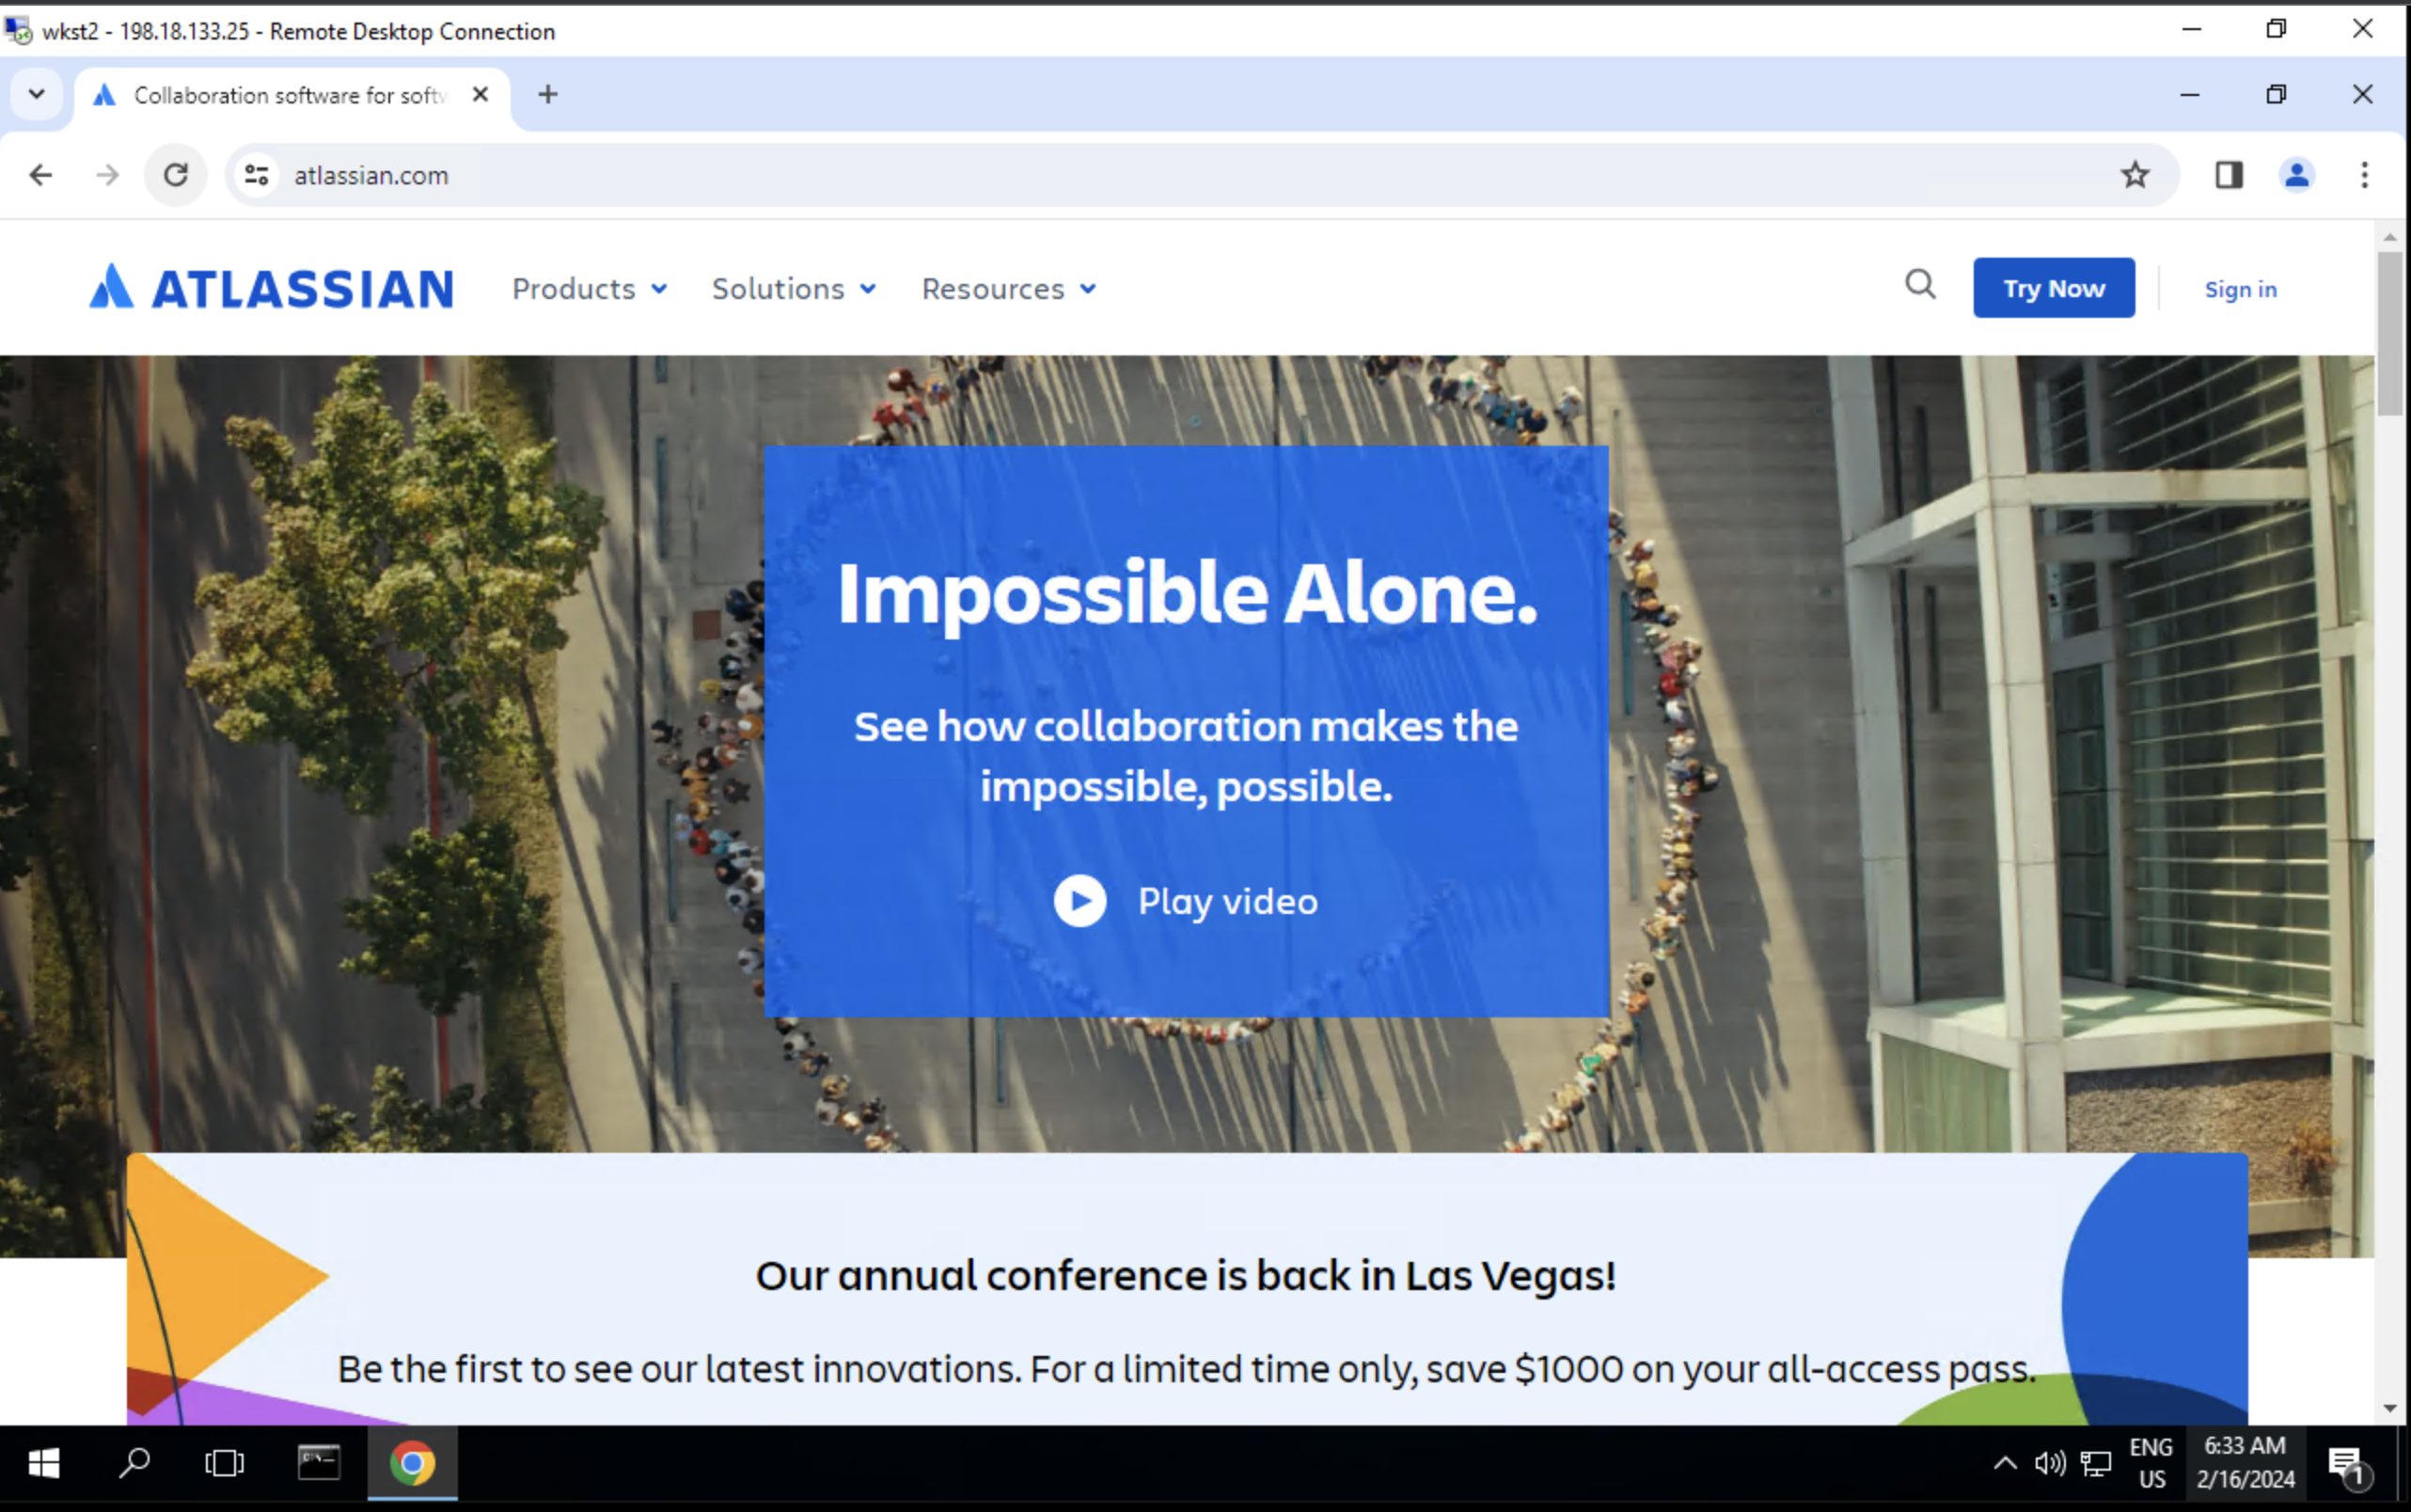
- Navigate to https://atlassian.com for Atlassian application traffic.
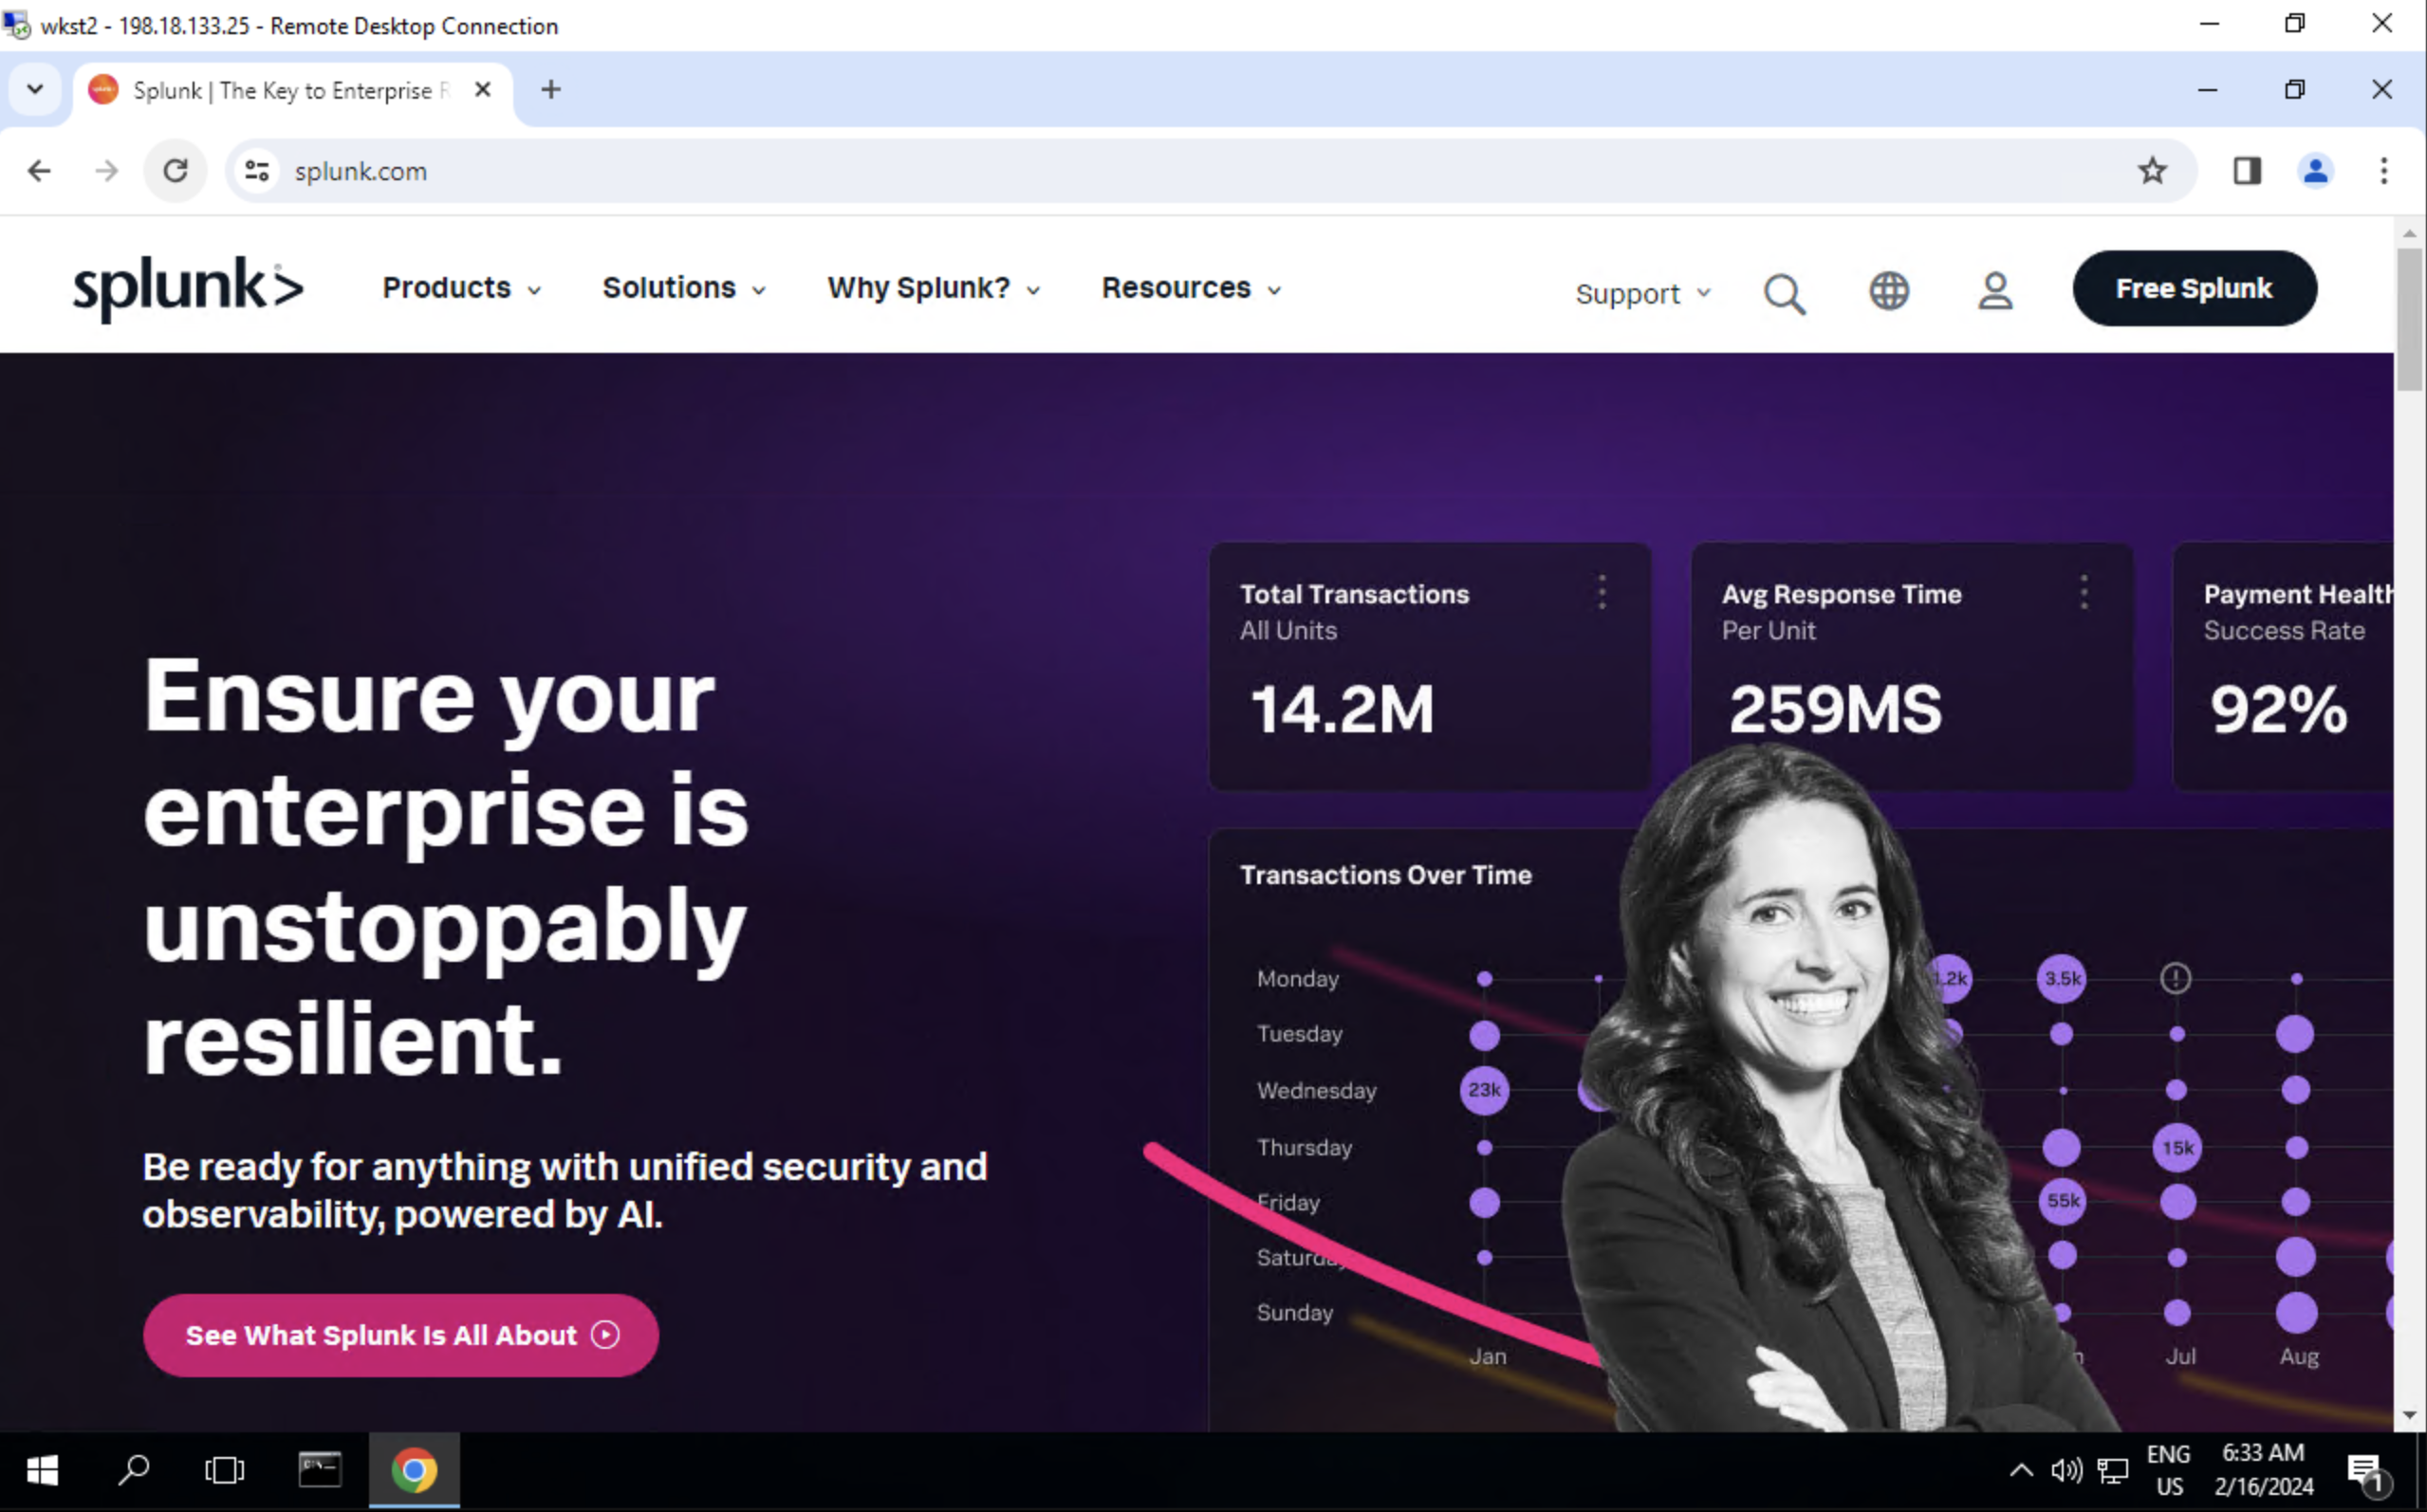
- Navigate to https://www.splunk.com for Splunk application traffic
Step 3: Initial Verification of applications traffic flow
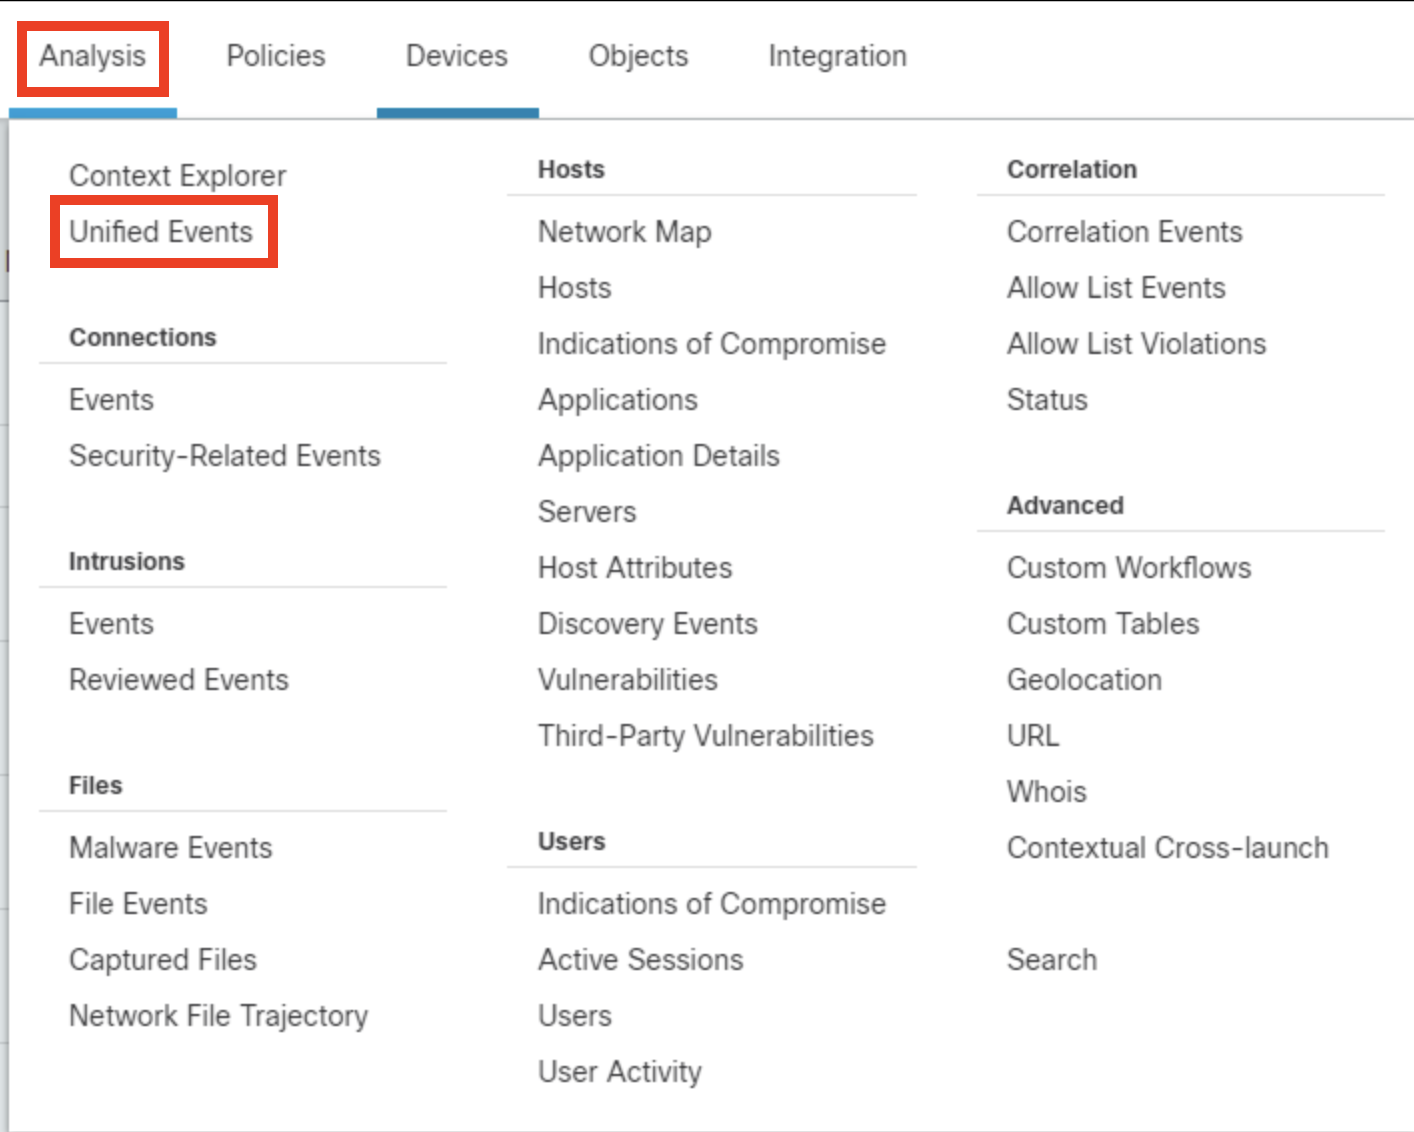
- Navigate back to the FMC web-interface. Click Analysis > Unified Events.
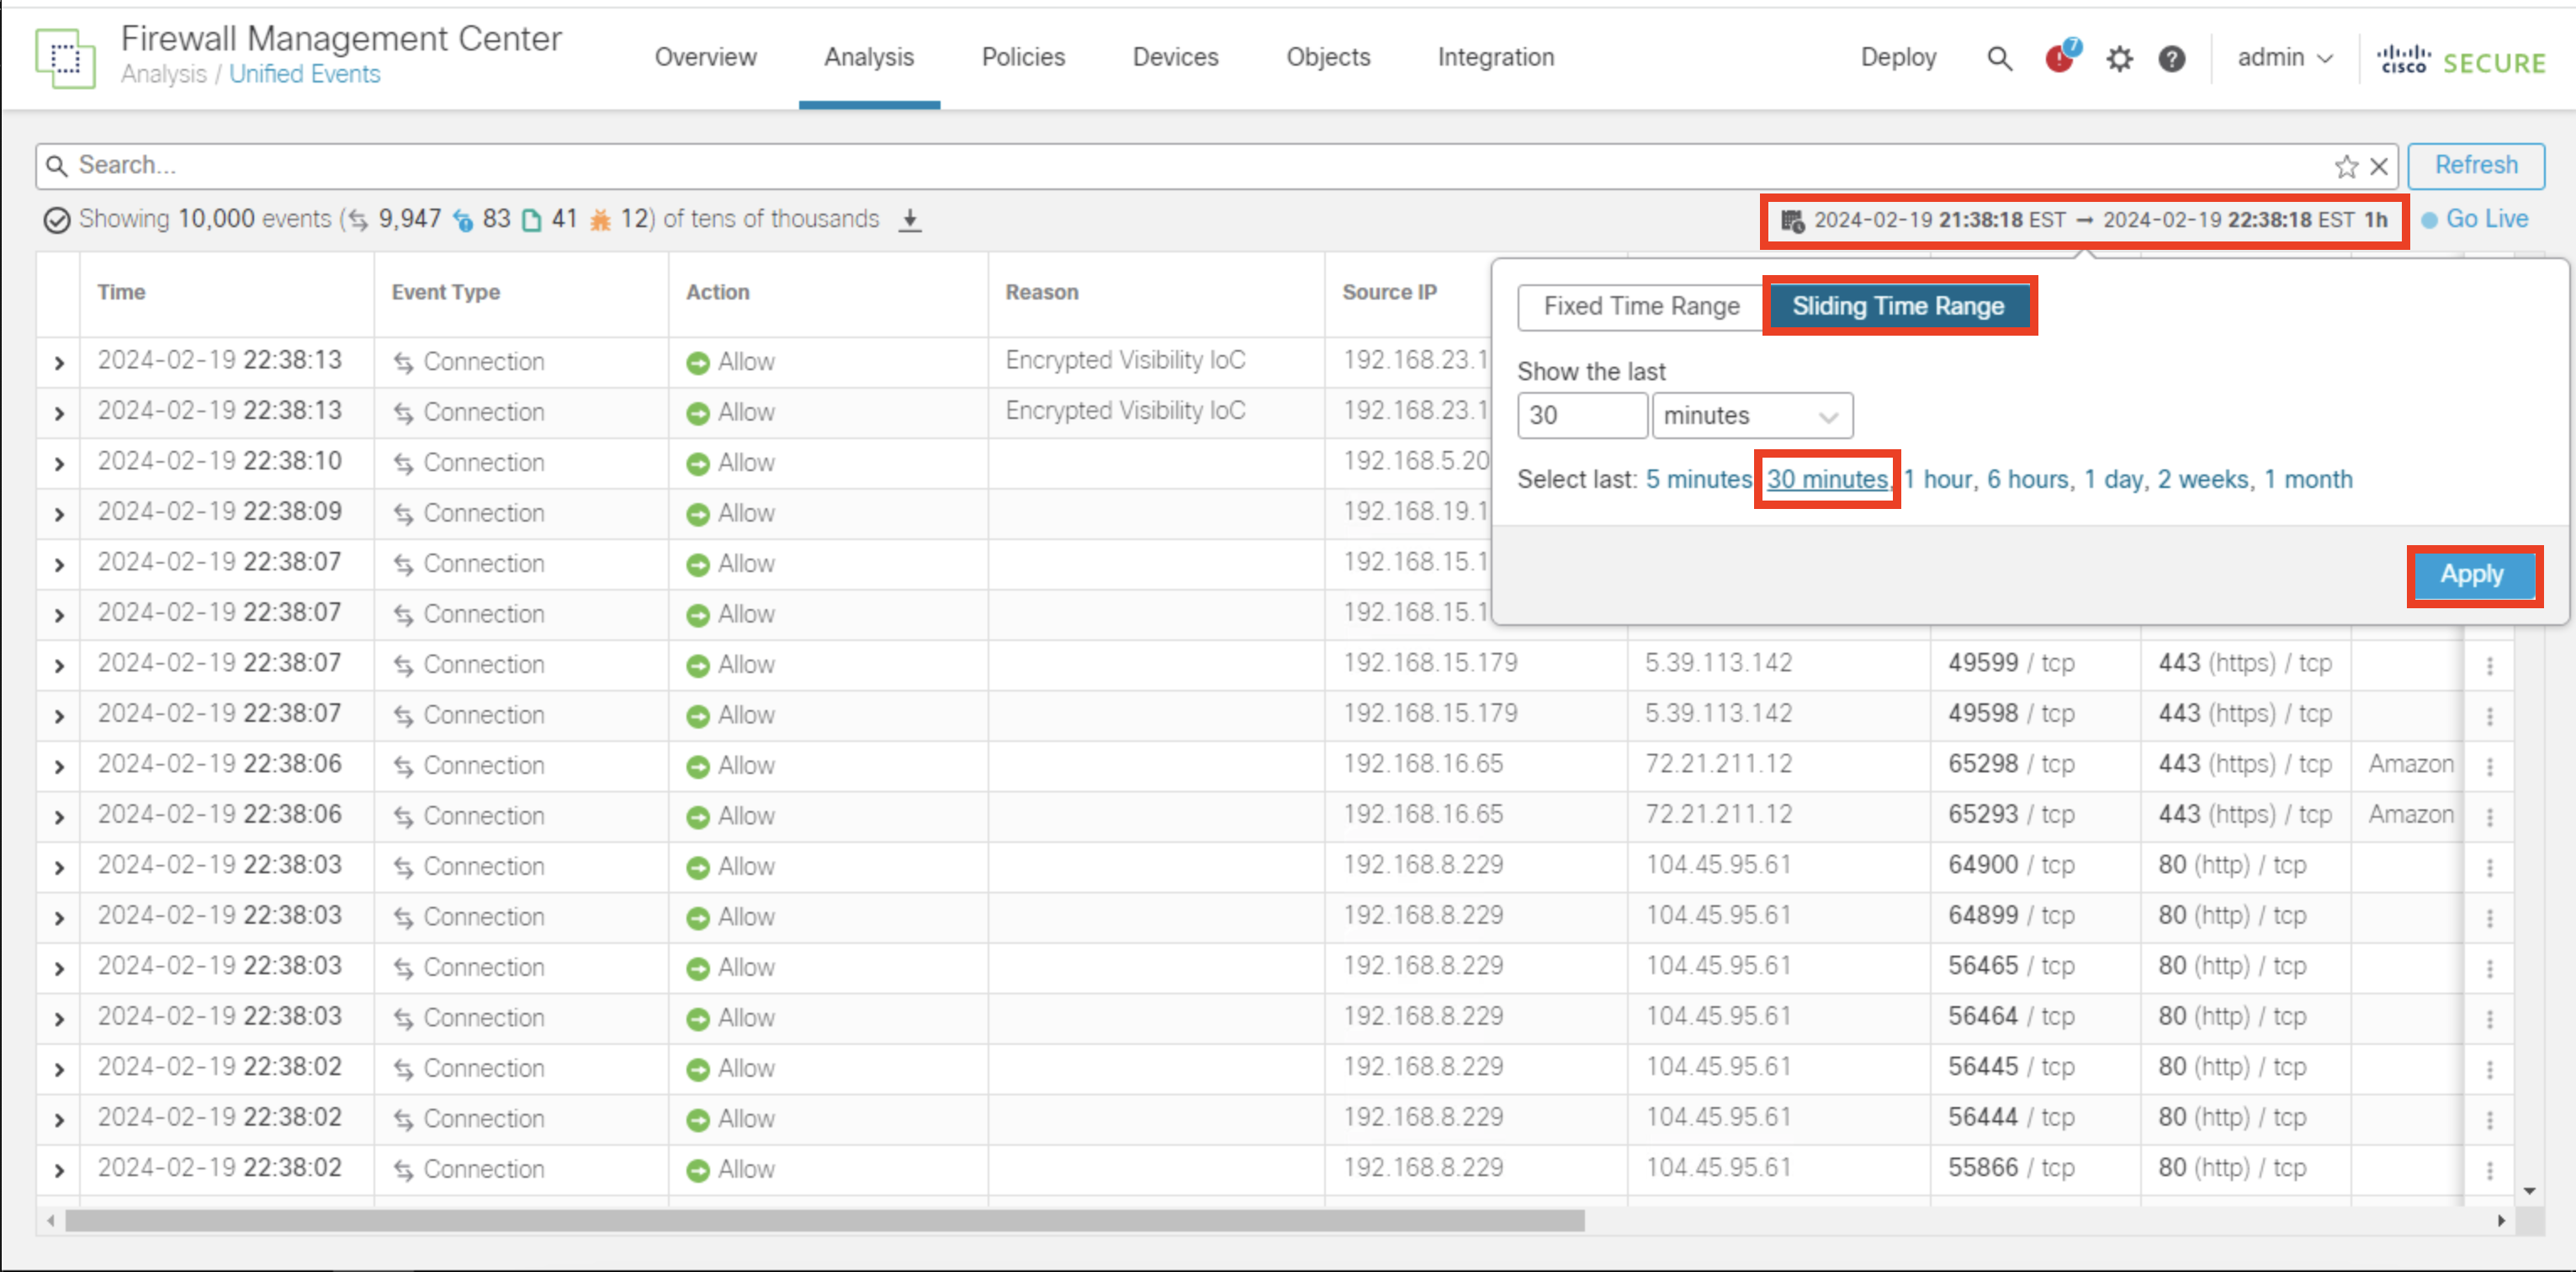
- Click on the time range on right top (shown below). Click on Sliding Time Range and set last 30 minutes to see the last 30 minutes logs. Click Apply
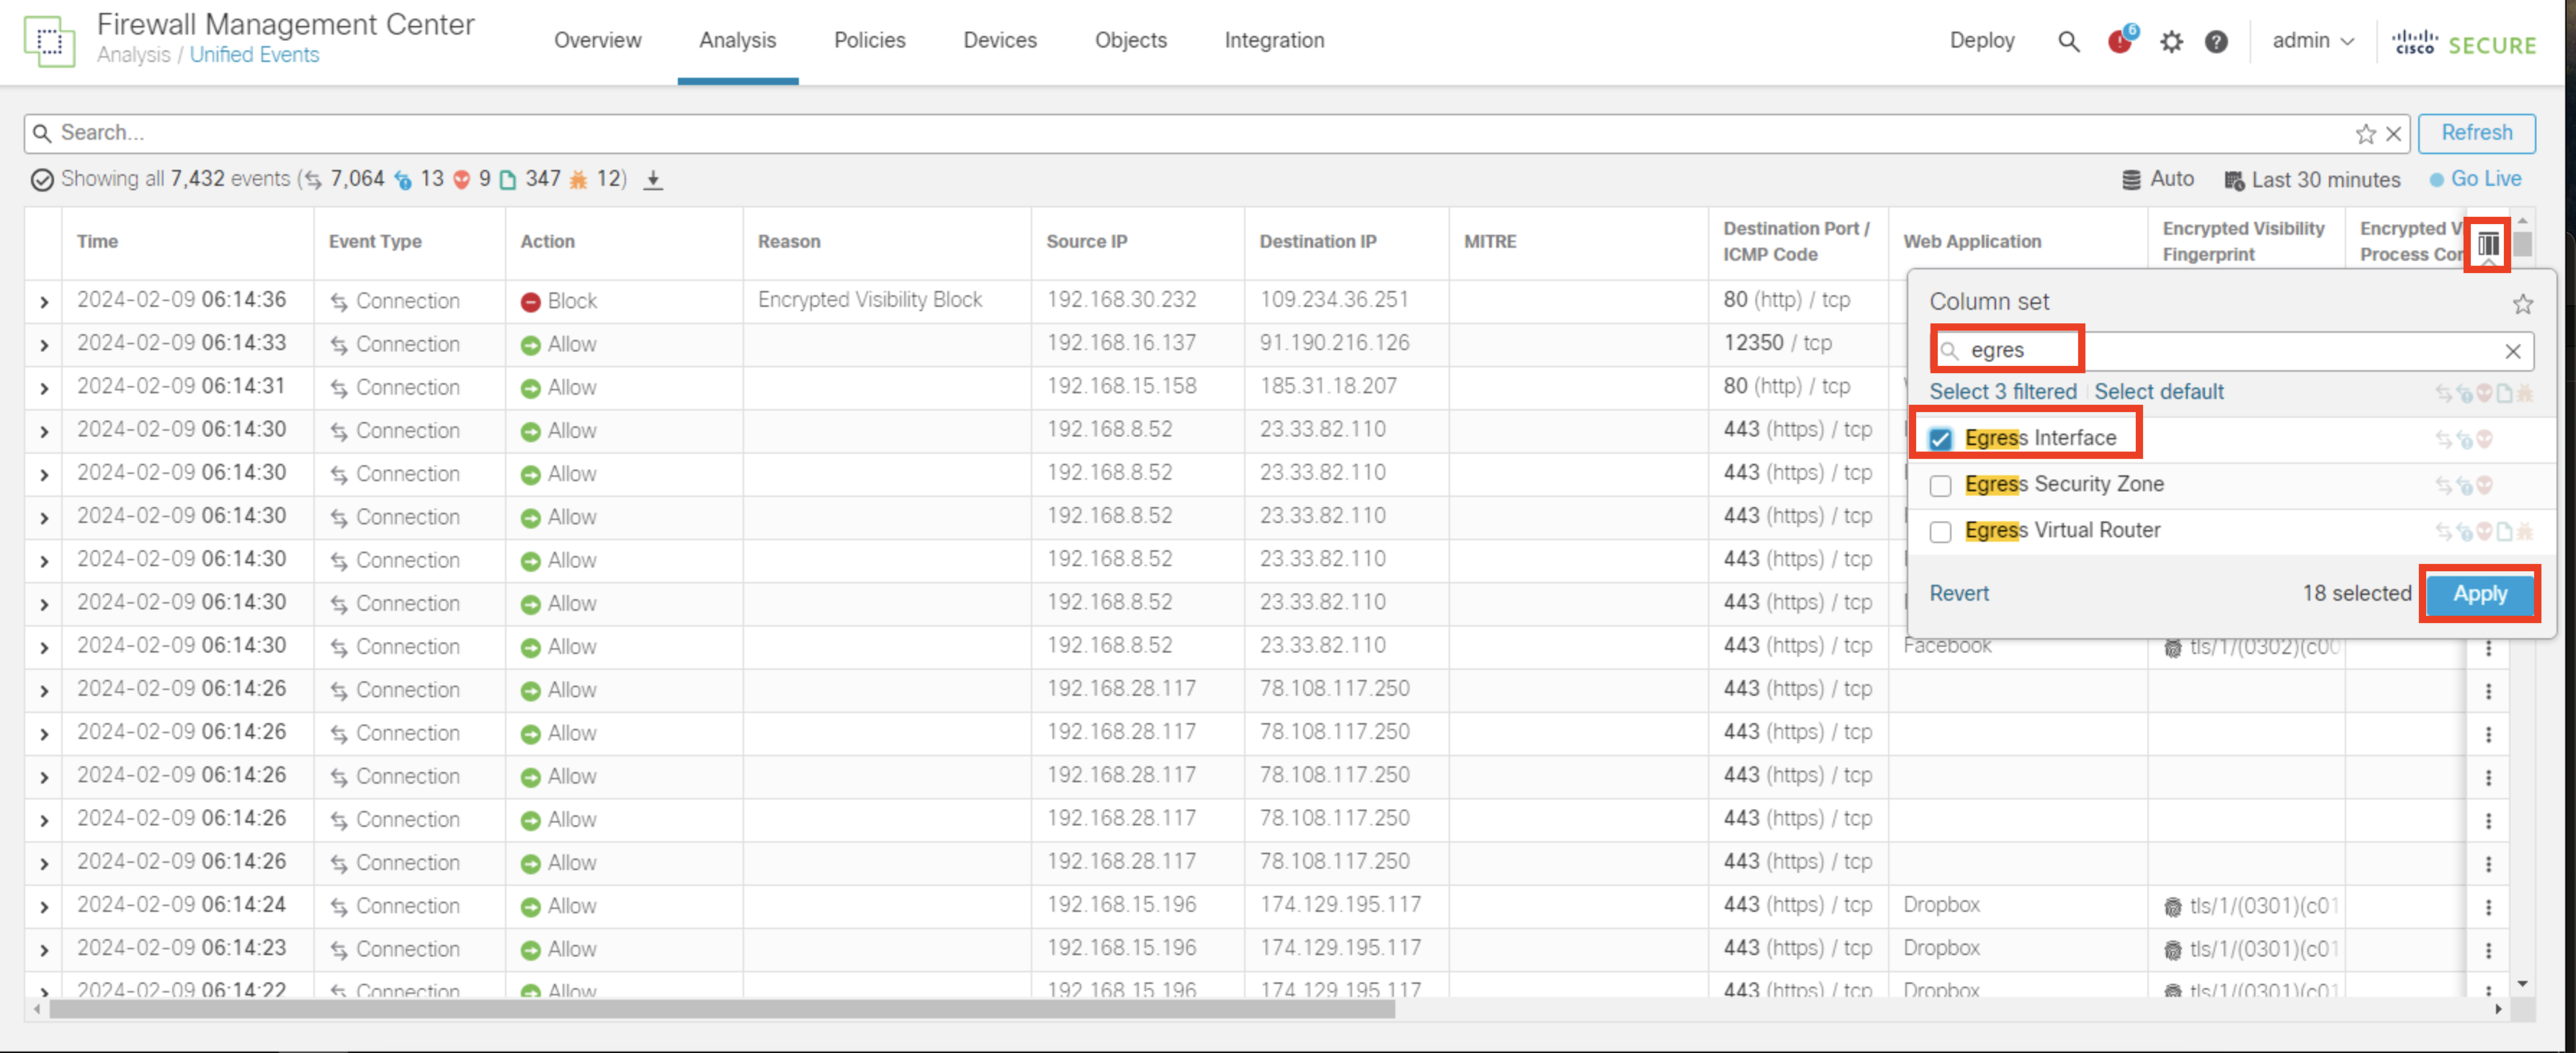
- Click on filter on the right to include Egress Interface as column in the eventing page and click Apply
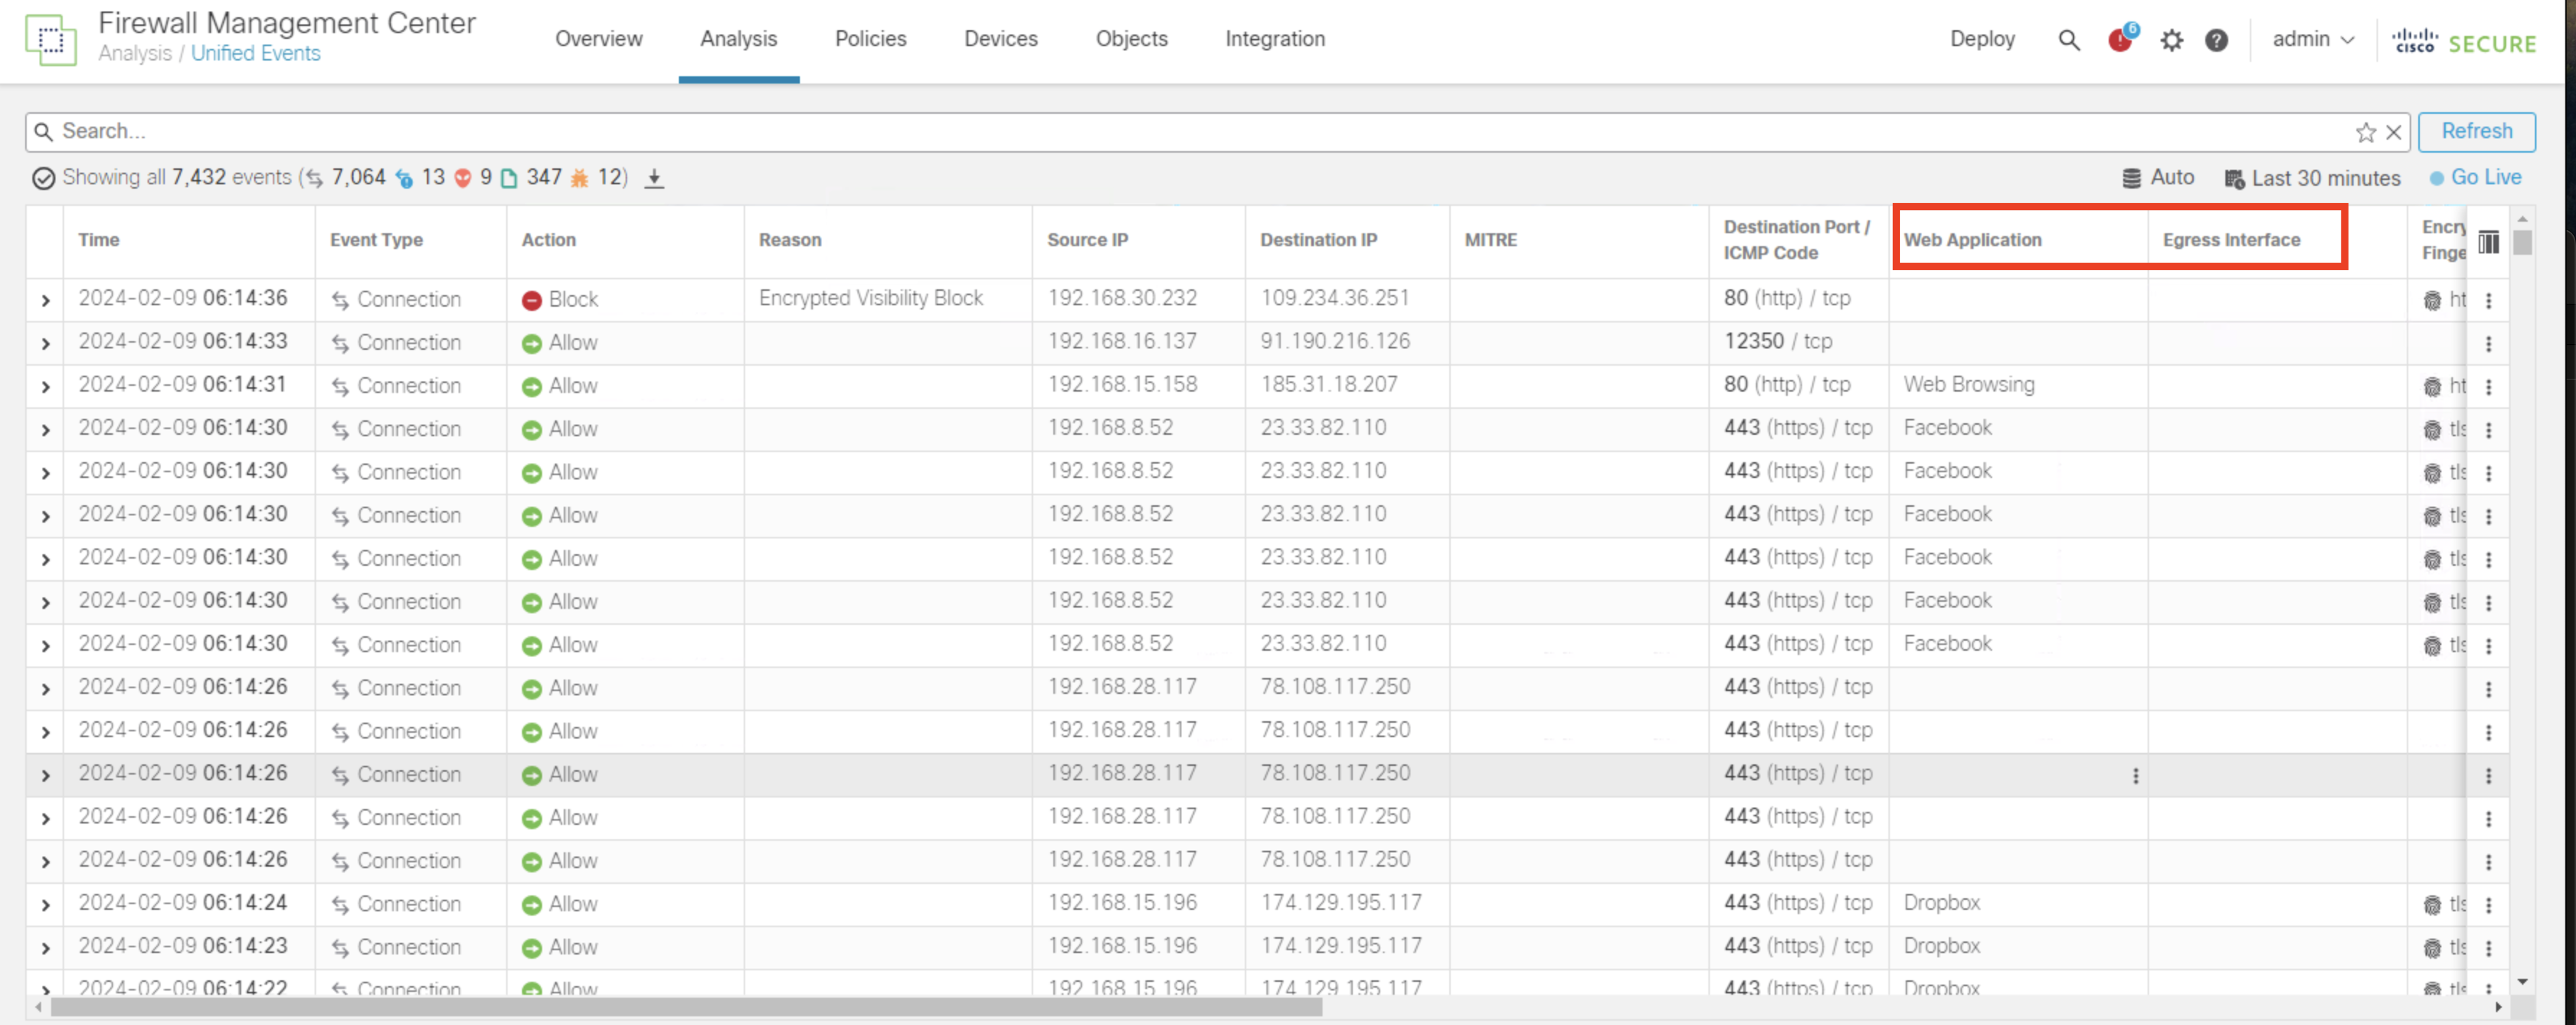
- For ease of verification, click and drag the newly added column Egress Interface (present on the far-right side of the output) adjacent to Web Application as shown below
- Click on search field and add a filter for Web Application and enter Box, Atlassian,Splunk as values and click Apply
- Observe the Egress interface for all the applications traffic, it will go through outside interface by default because we have the default route pointing to outside interface

Note
Connection Events may take a few minutes to populate in the Unified Event Viewer. If you are not seeing similar output to the above screenshot, click Go Live , test the connections from another web browser (or clear cache), and observe the Connection Events in the output of the Unified Event Viewer.
Task 4: Configure Prerequisites
In this task, we will configure all the prerequisites needed for configuring policy based routing.
Step 1 : Configure Trusted DNS Server
Application detection in Direct Internet Access feature relies on DNS snooping to resolve applications or a group of applications. To ensure that DNS requests are not resolved by rogue DNS servers and are indeed locked to desired DNS servers, Firewall Management Center(FMC) allows you to configure Trusted DNS server for Cisco Secure Firewall Threat Defense.
-
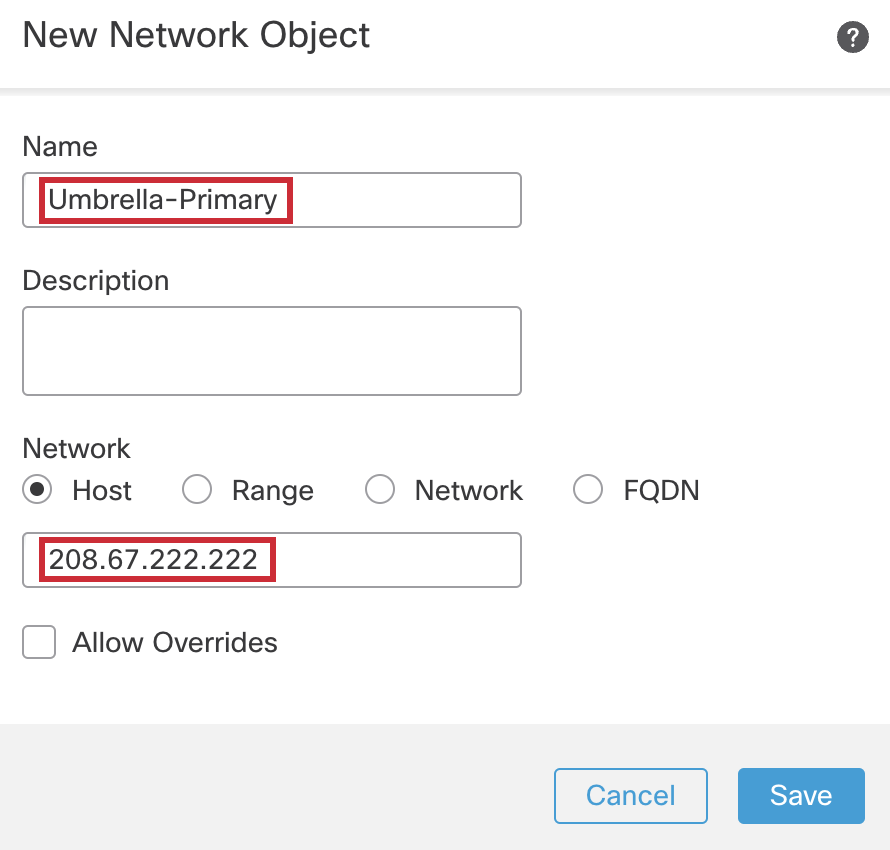
To configure the Trusted DNS Servers, click Object > Object Management > Add Network > Add Object


-
In the pop-up box, configure the Network Object as follows:
-
Name: Umbrella-Primary
-
Network type should be Host by default.
-
Address: 208.67.222.222
-
Then click on Save.
-
-
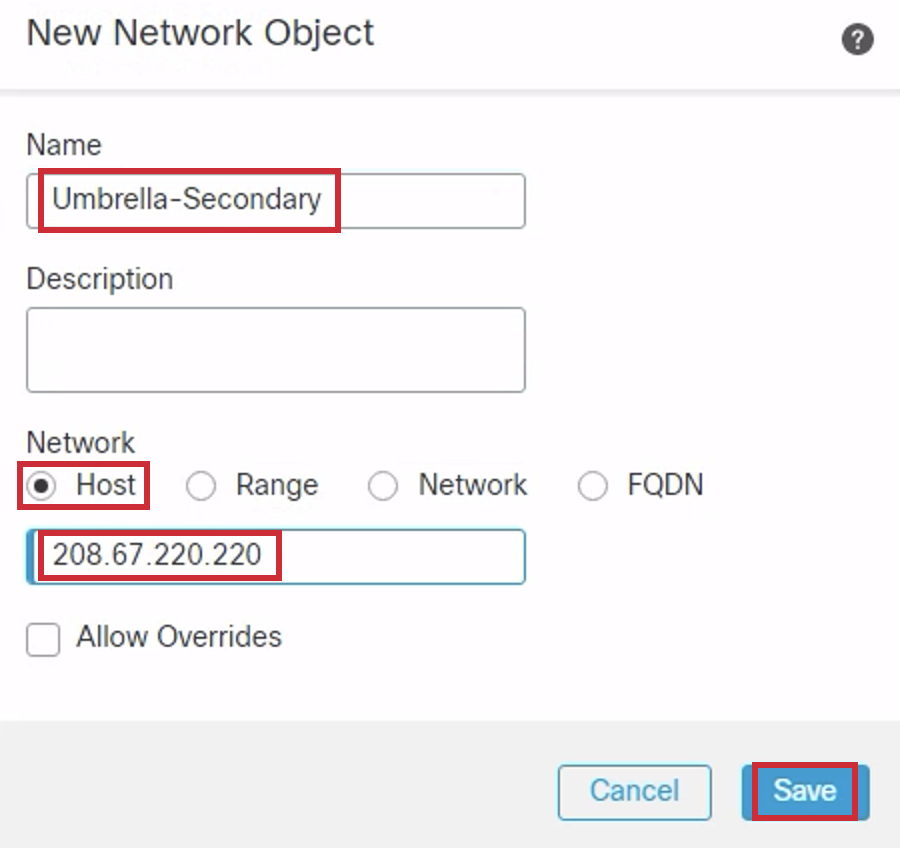
Click Add Network > Add Object again

-
In the pop-up box, configure the Network Object as follows:
-
Name: Umbrella-Secondary
-
Network type should be Host by default.
-
Address: 208.67.220.220
-
Then click on Save.
-
-
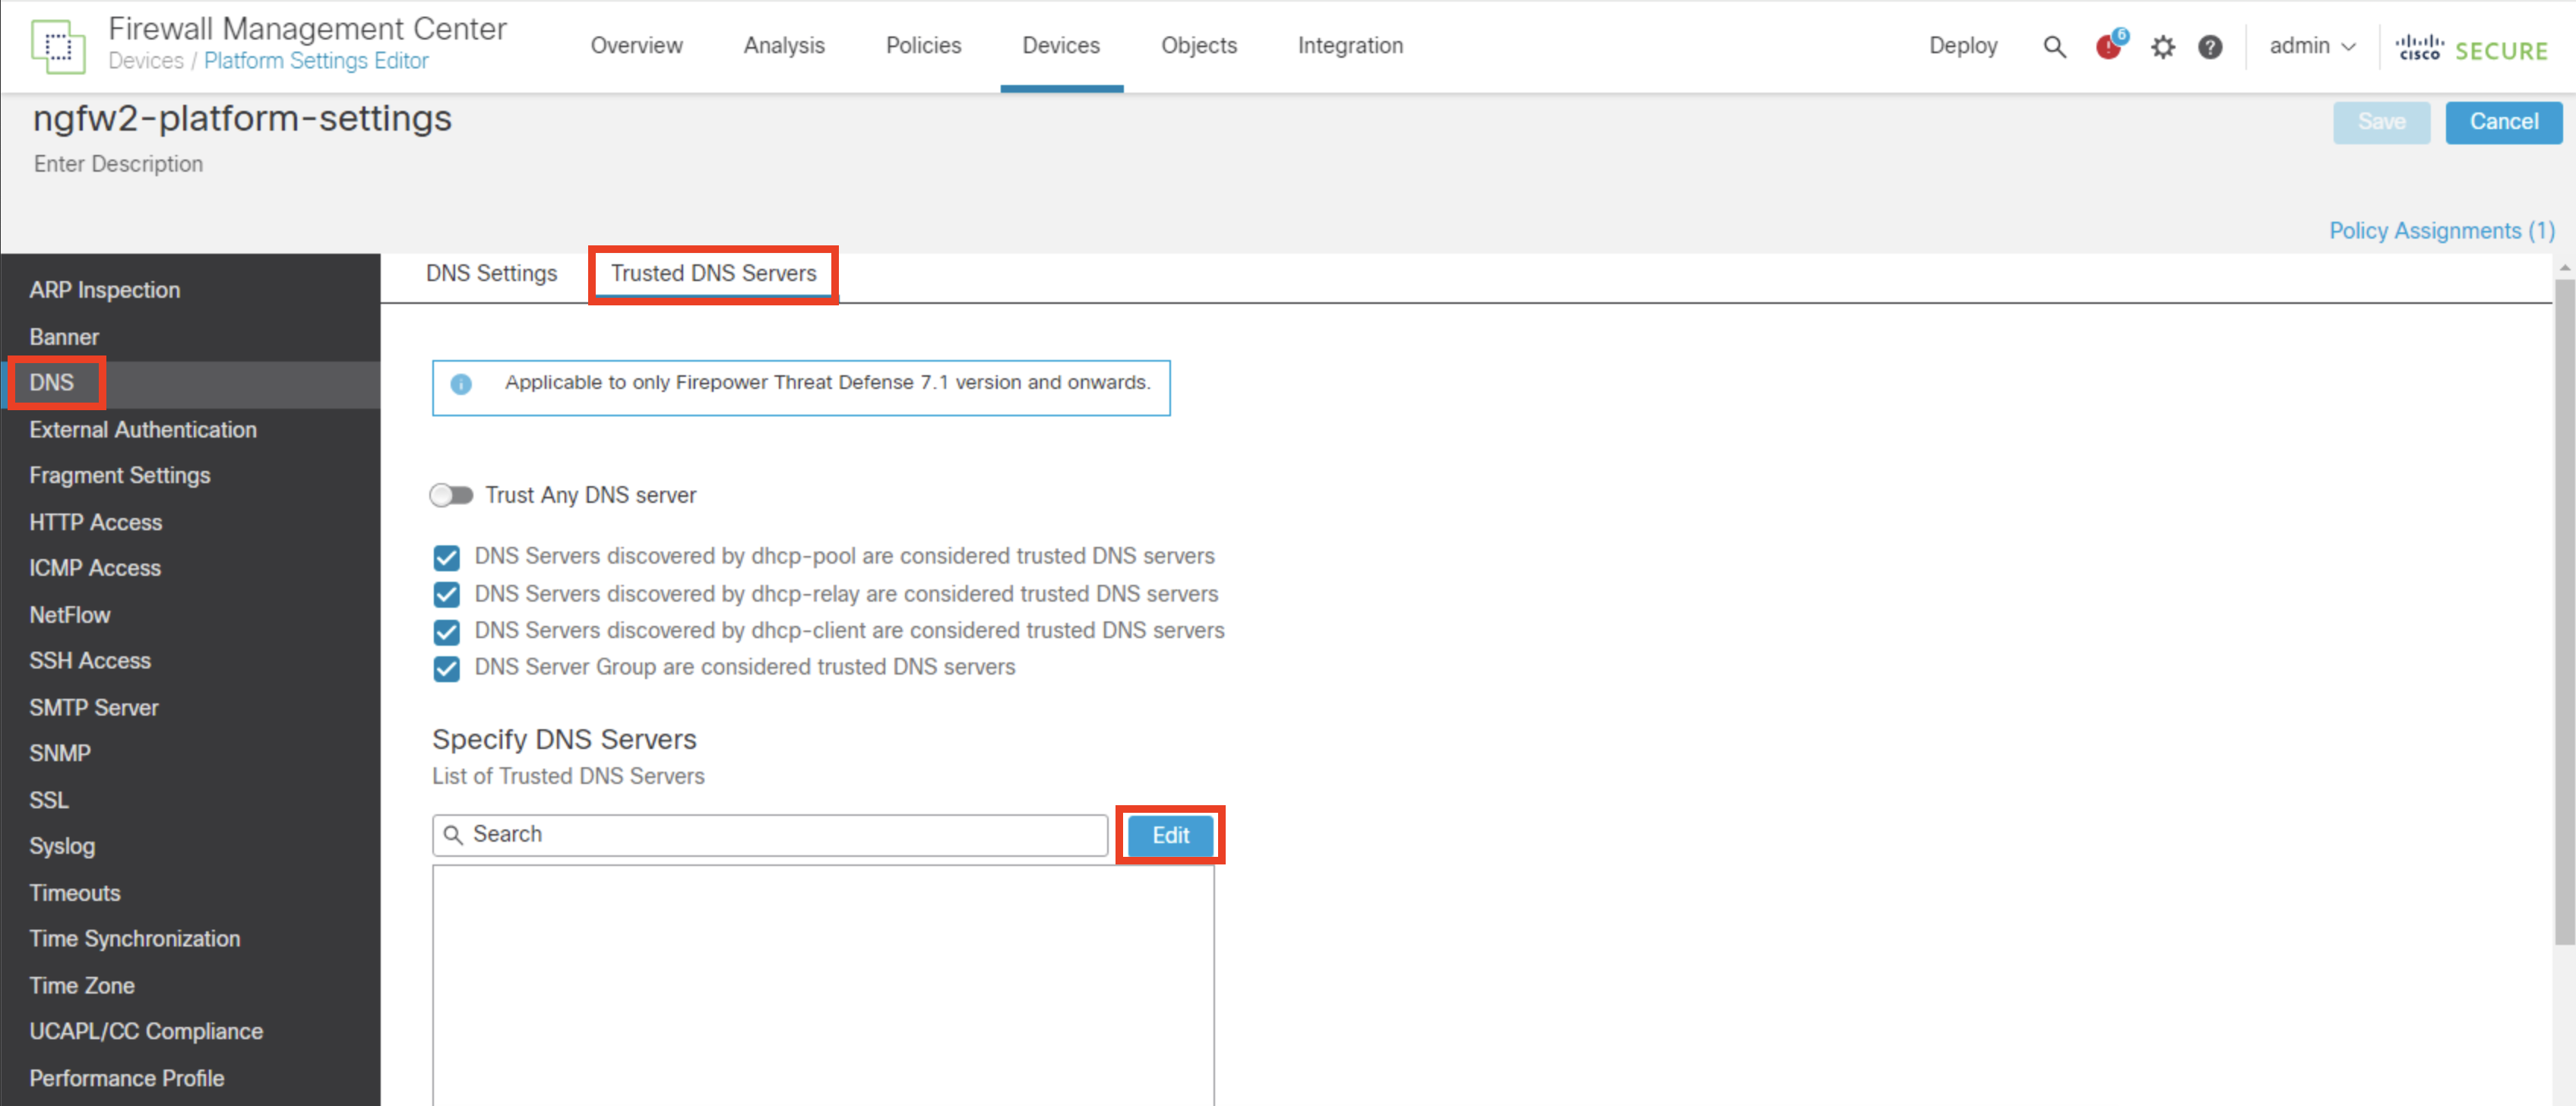
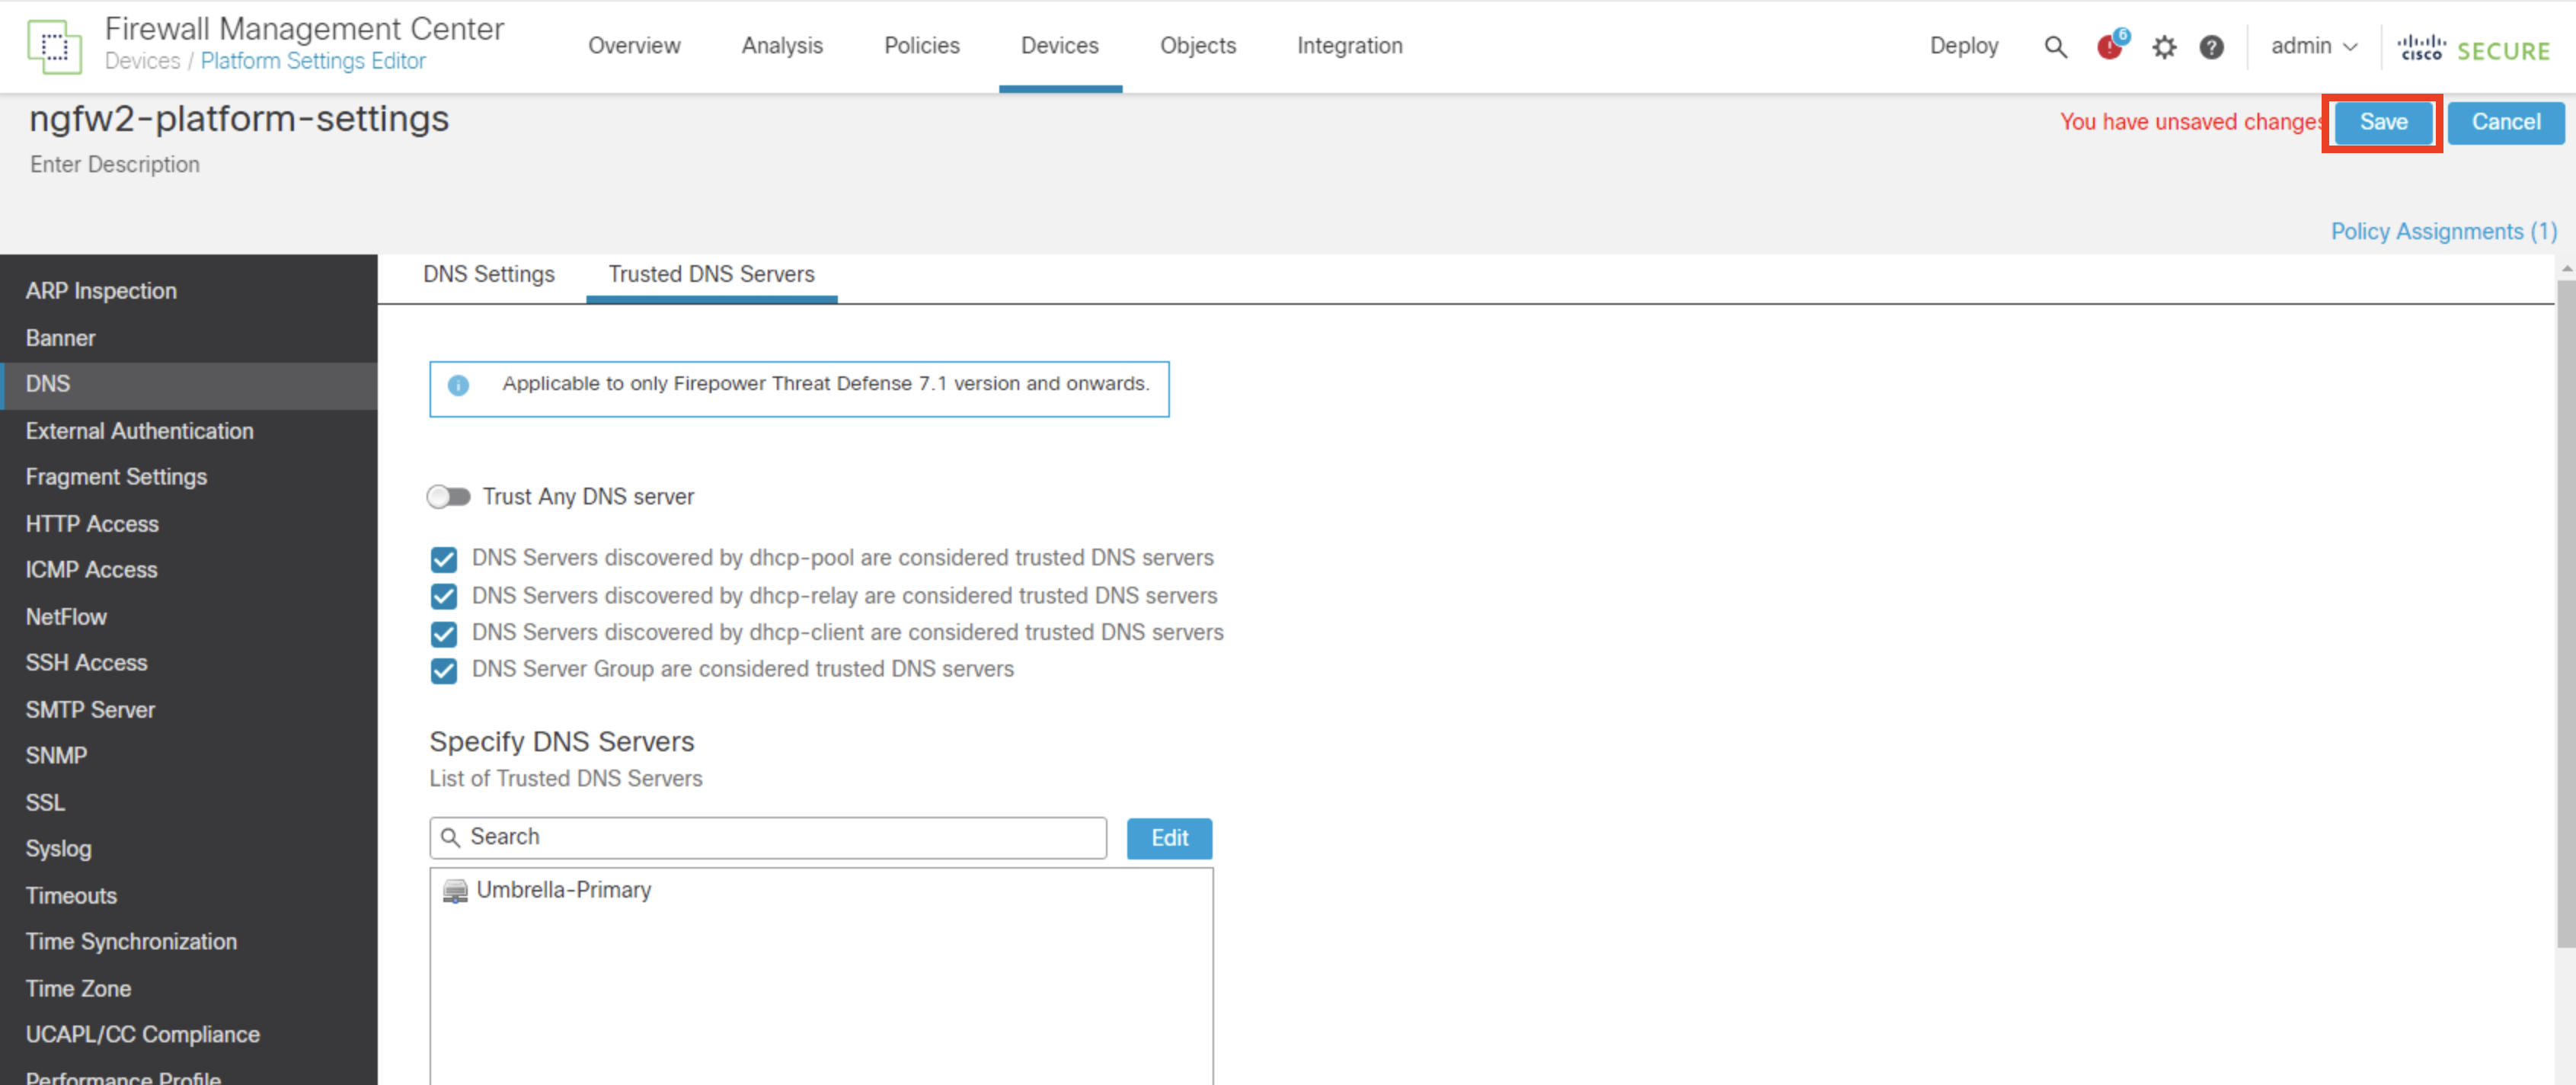
Click Devices > Platform Settings.

- Click the pencil icon to edit ngfw2-platform-settings.

- Click DNS
- Navigate to Trusted DNS Servers
- Click Edit to specify Trusted DNS Servers
- Search Umbrella-Primary under Available Host Objects and click Add
- Click Save to write the Trusted DNS Servers changes
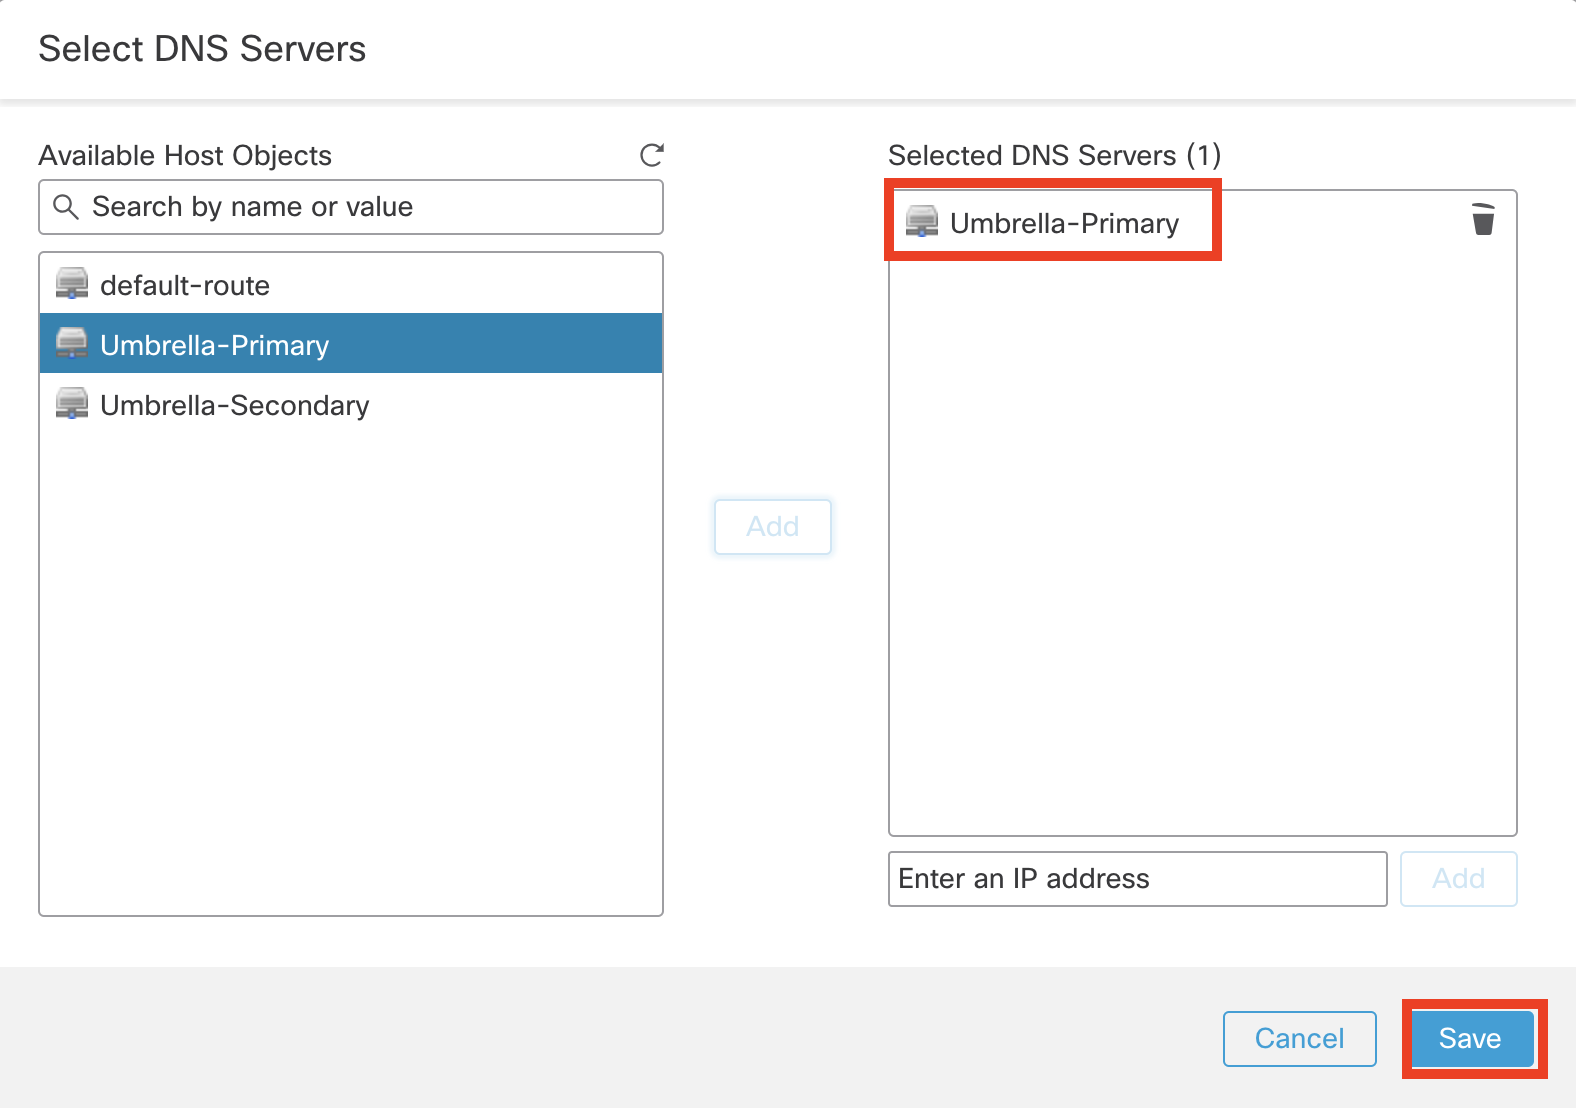
- Click Save on the top right to save the changes for platform settings.
Step 2: Configure Interface Priority
To configure interface priorities:
- Click on Devices > Device Management
- Click on the pencil icon of NGFW2 and then click the Routing tab.
- Click Policy Based Routing.
- Click on Configure Interface priority
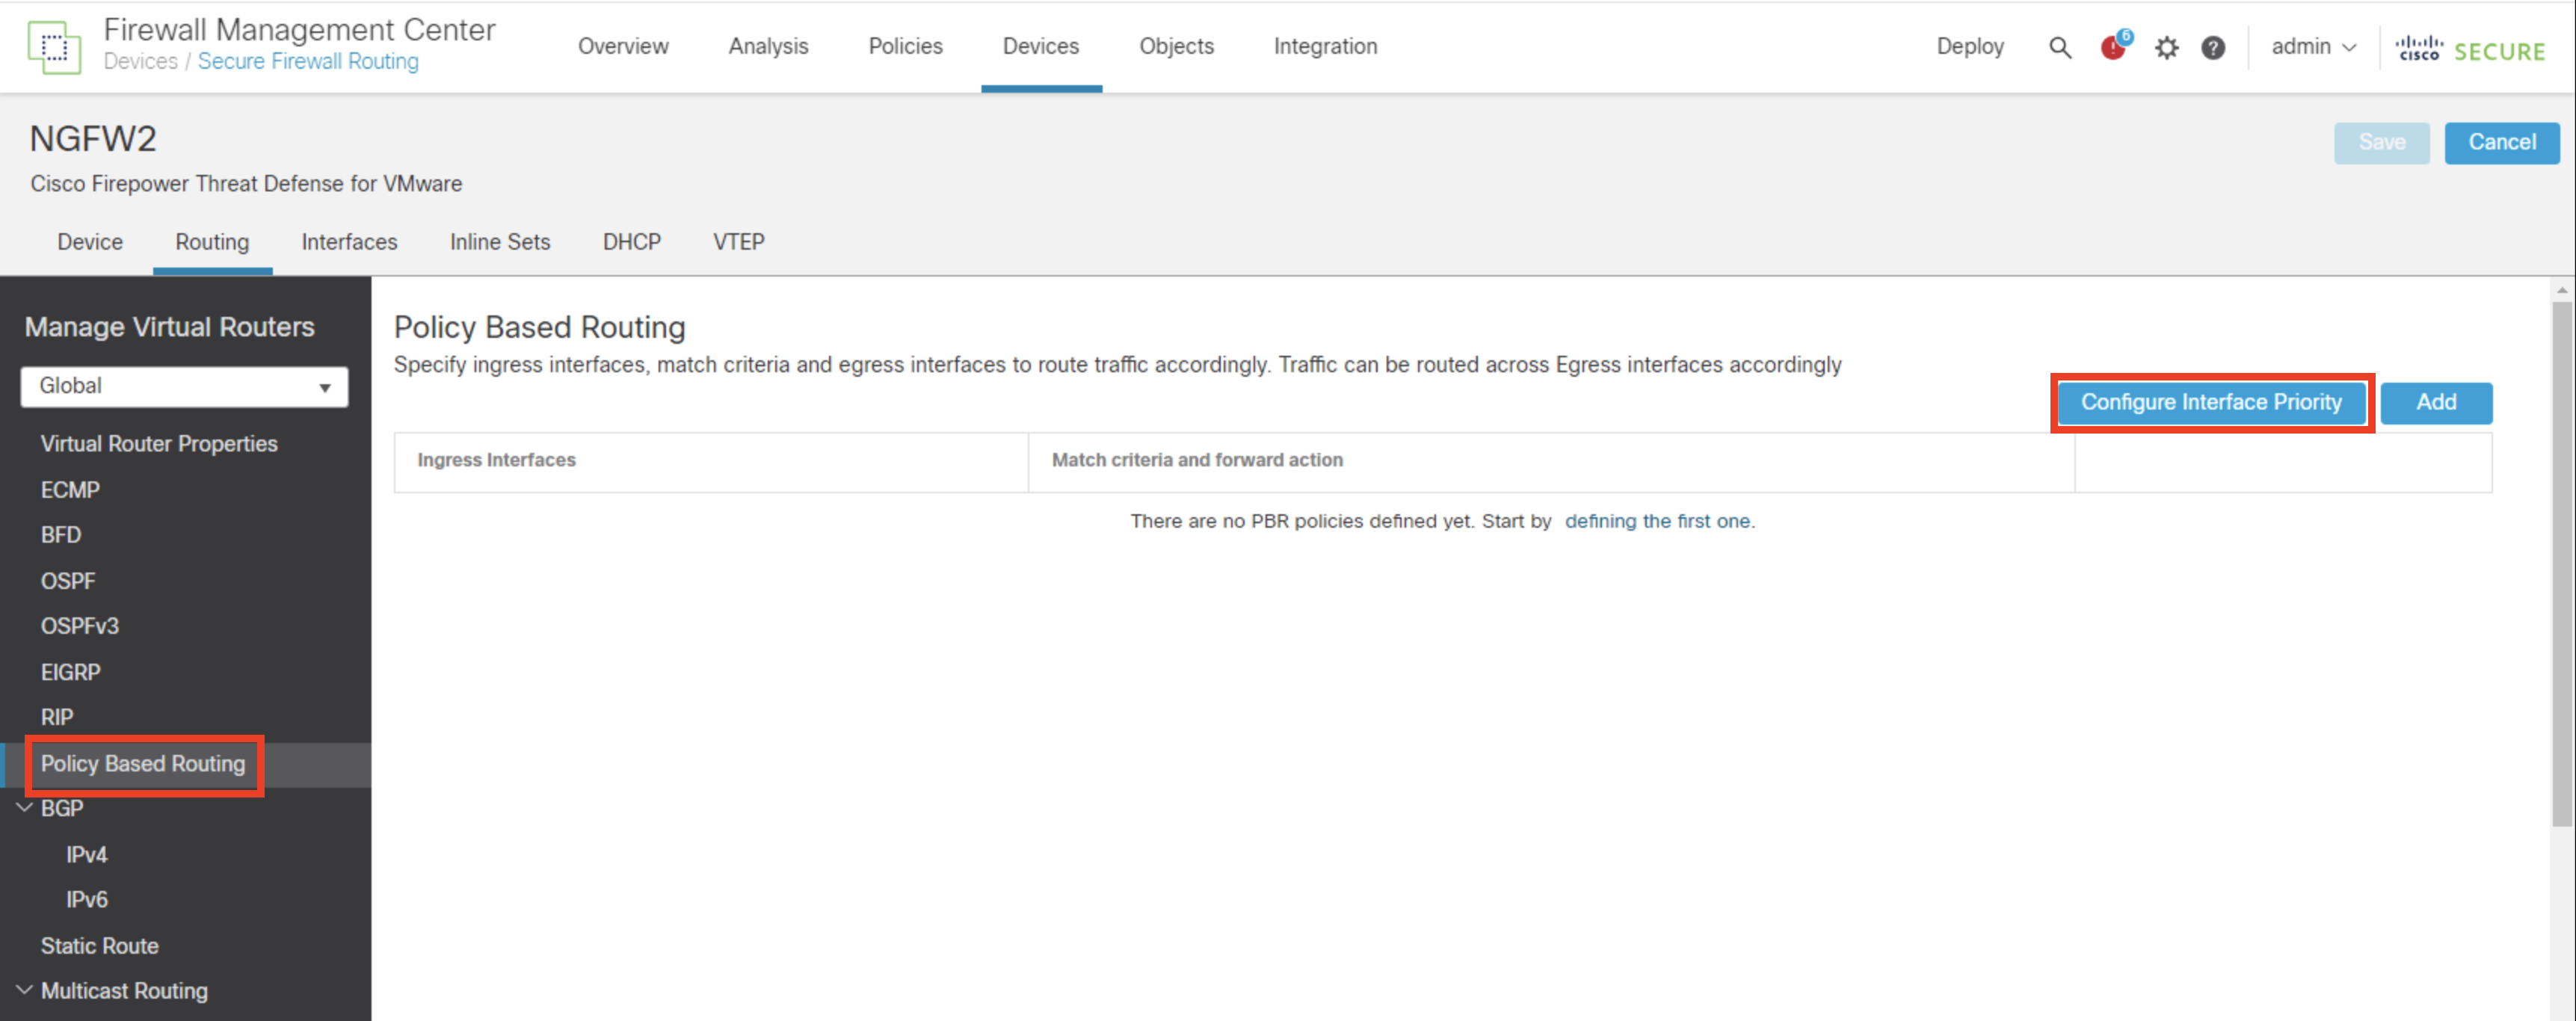
- Set the interface priority of outside to 20 and outside2 to 10.
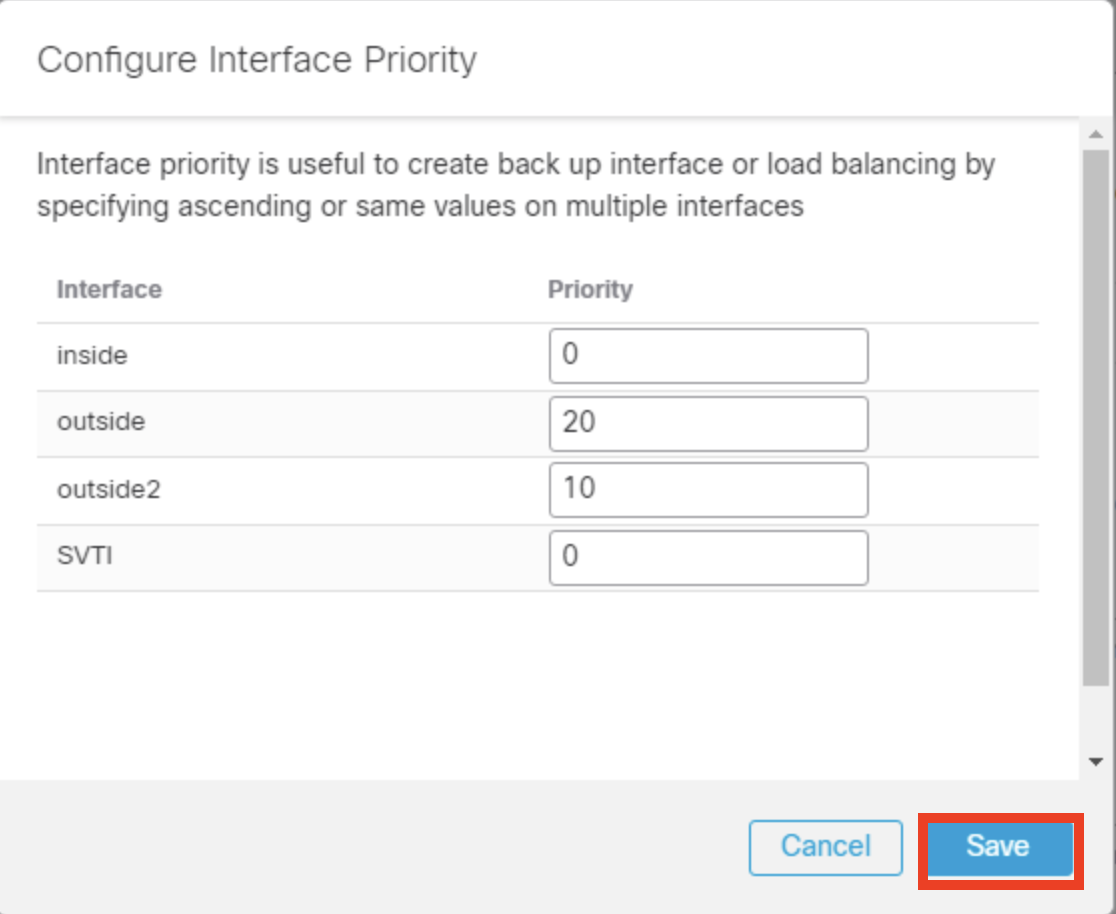
- Click Save
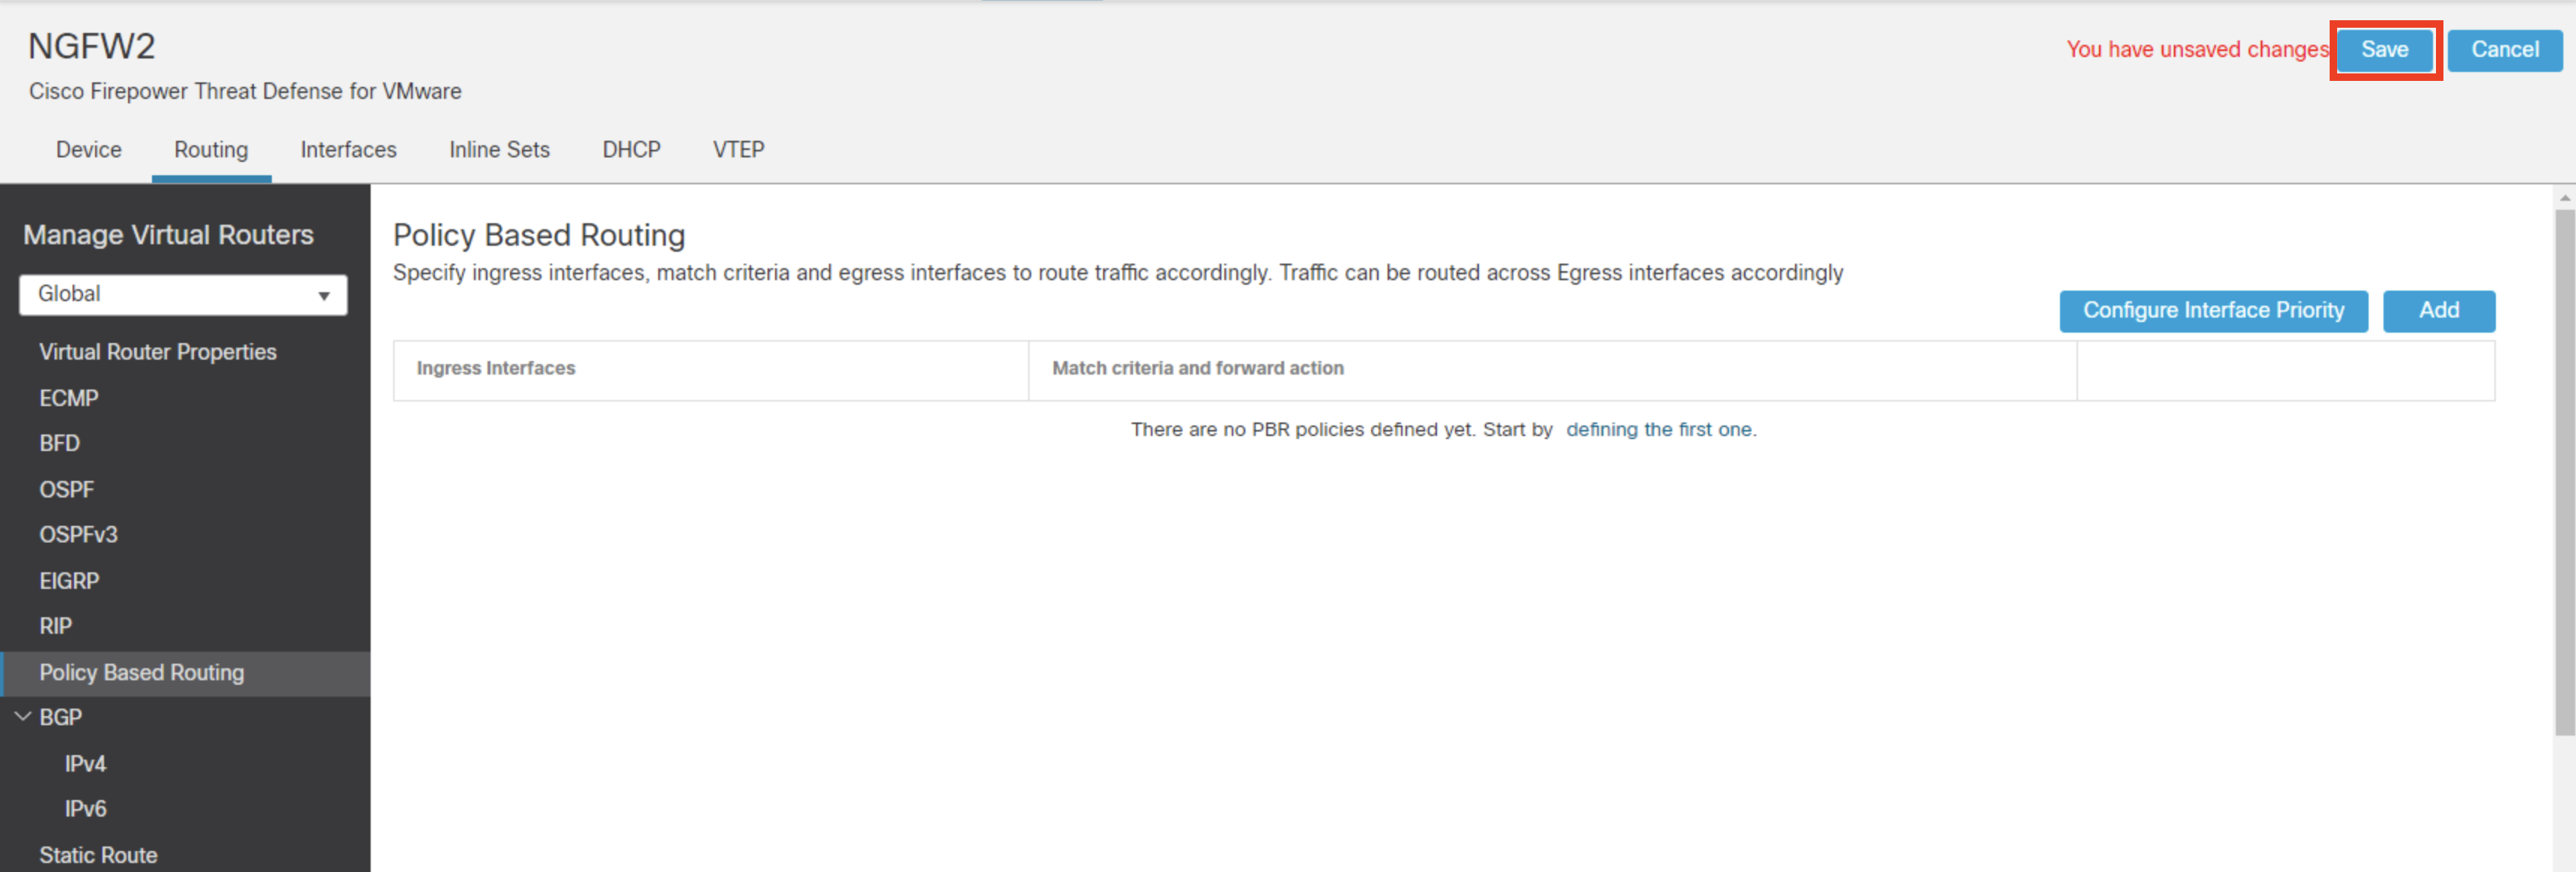
- Click Save on the top right to save the changes.
Step 3 : Configure Extended Access List for Box Application
In this step, we will create an extended access list for Box application
- Navigate to Objects > Object Management > Access List
- Click Extended. Click Add Extended Access List on top to create an extended access list for Box Traffic.

- For name, enter Box-ACL
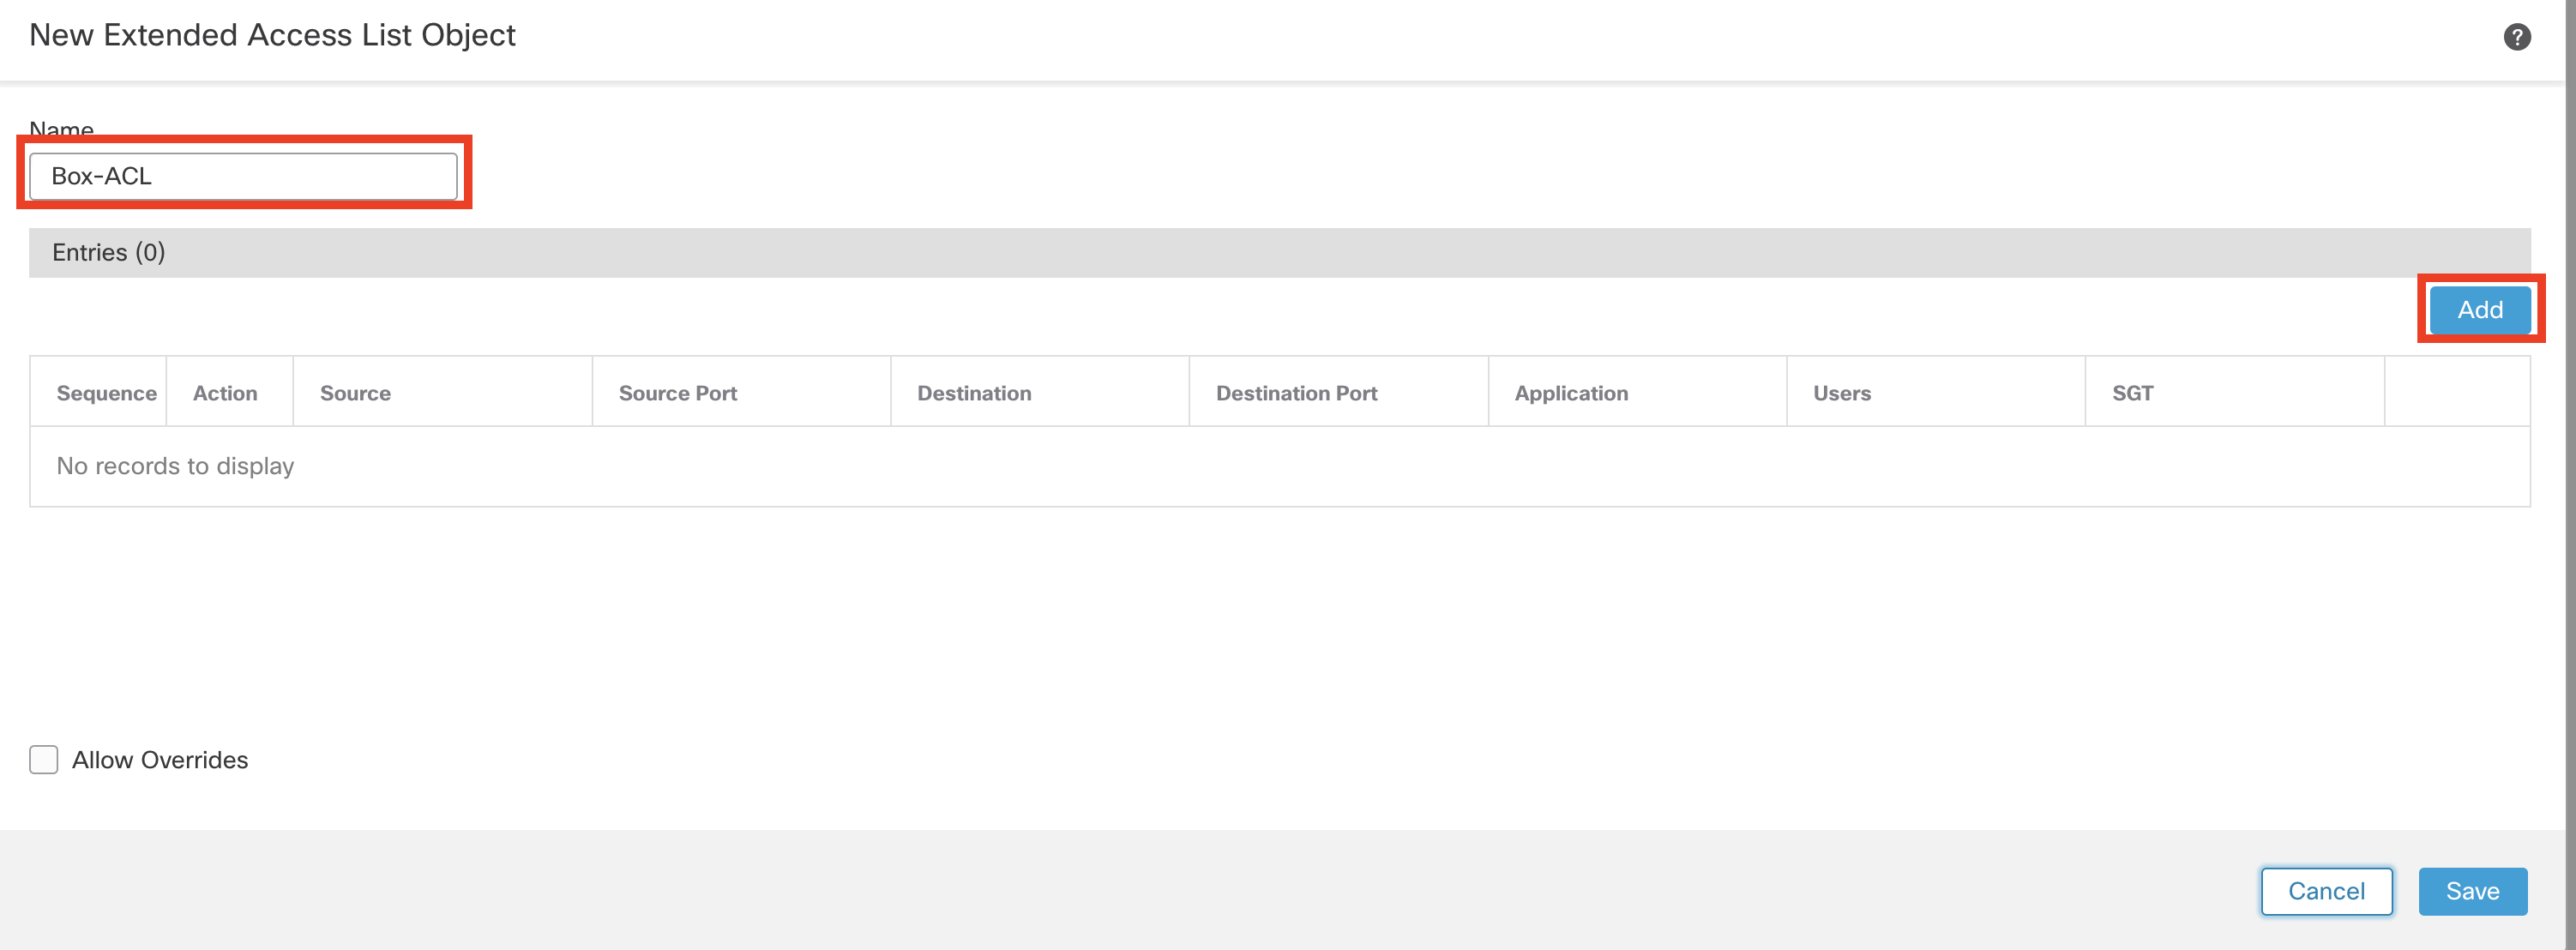
- Click Add
-
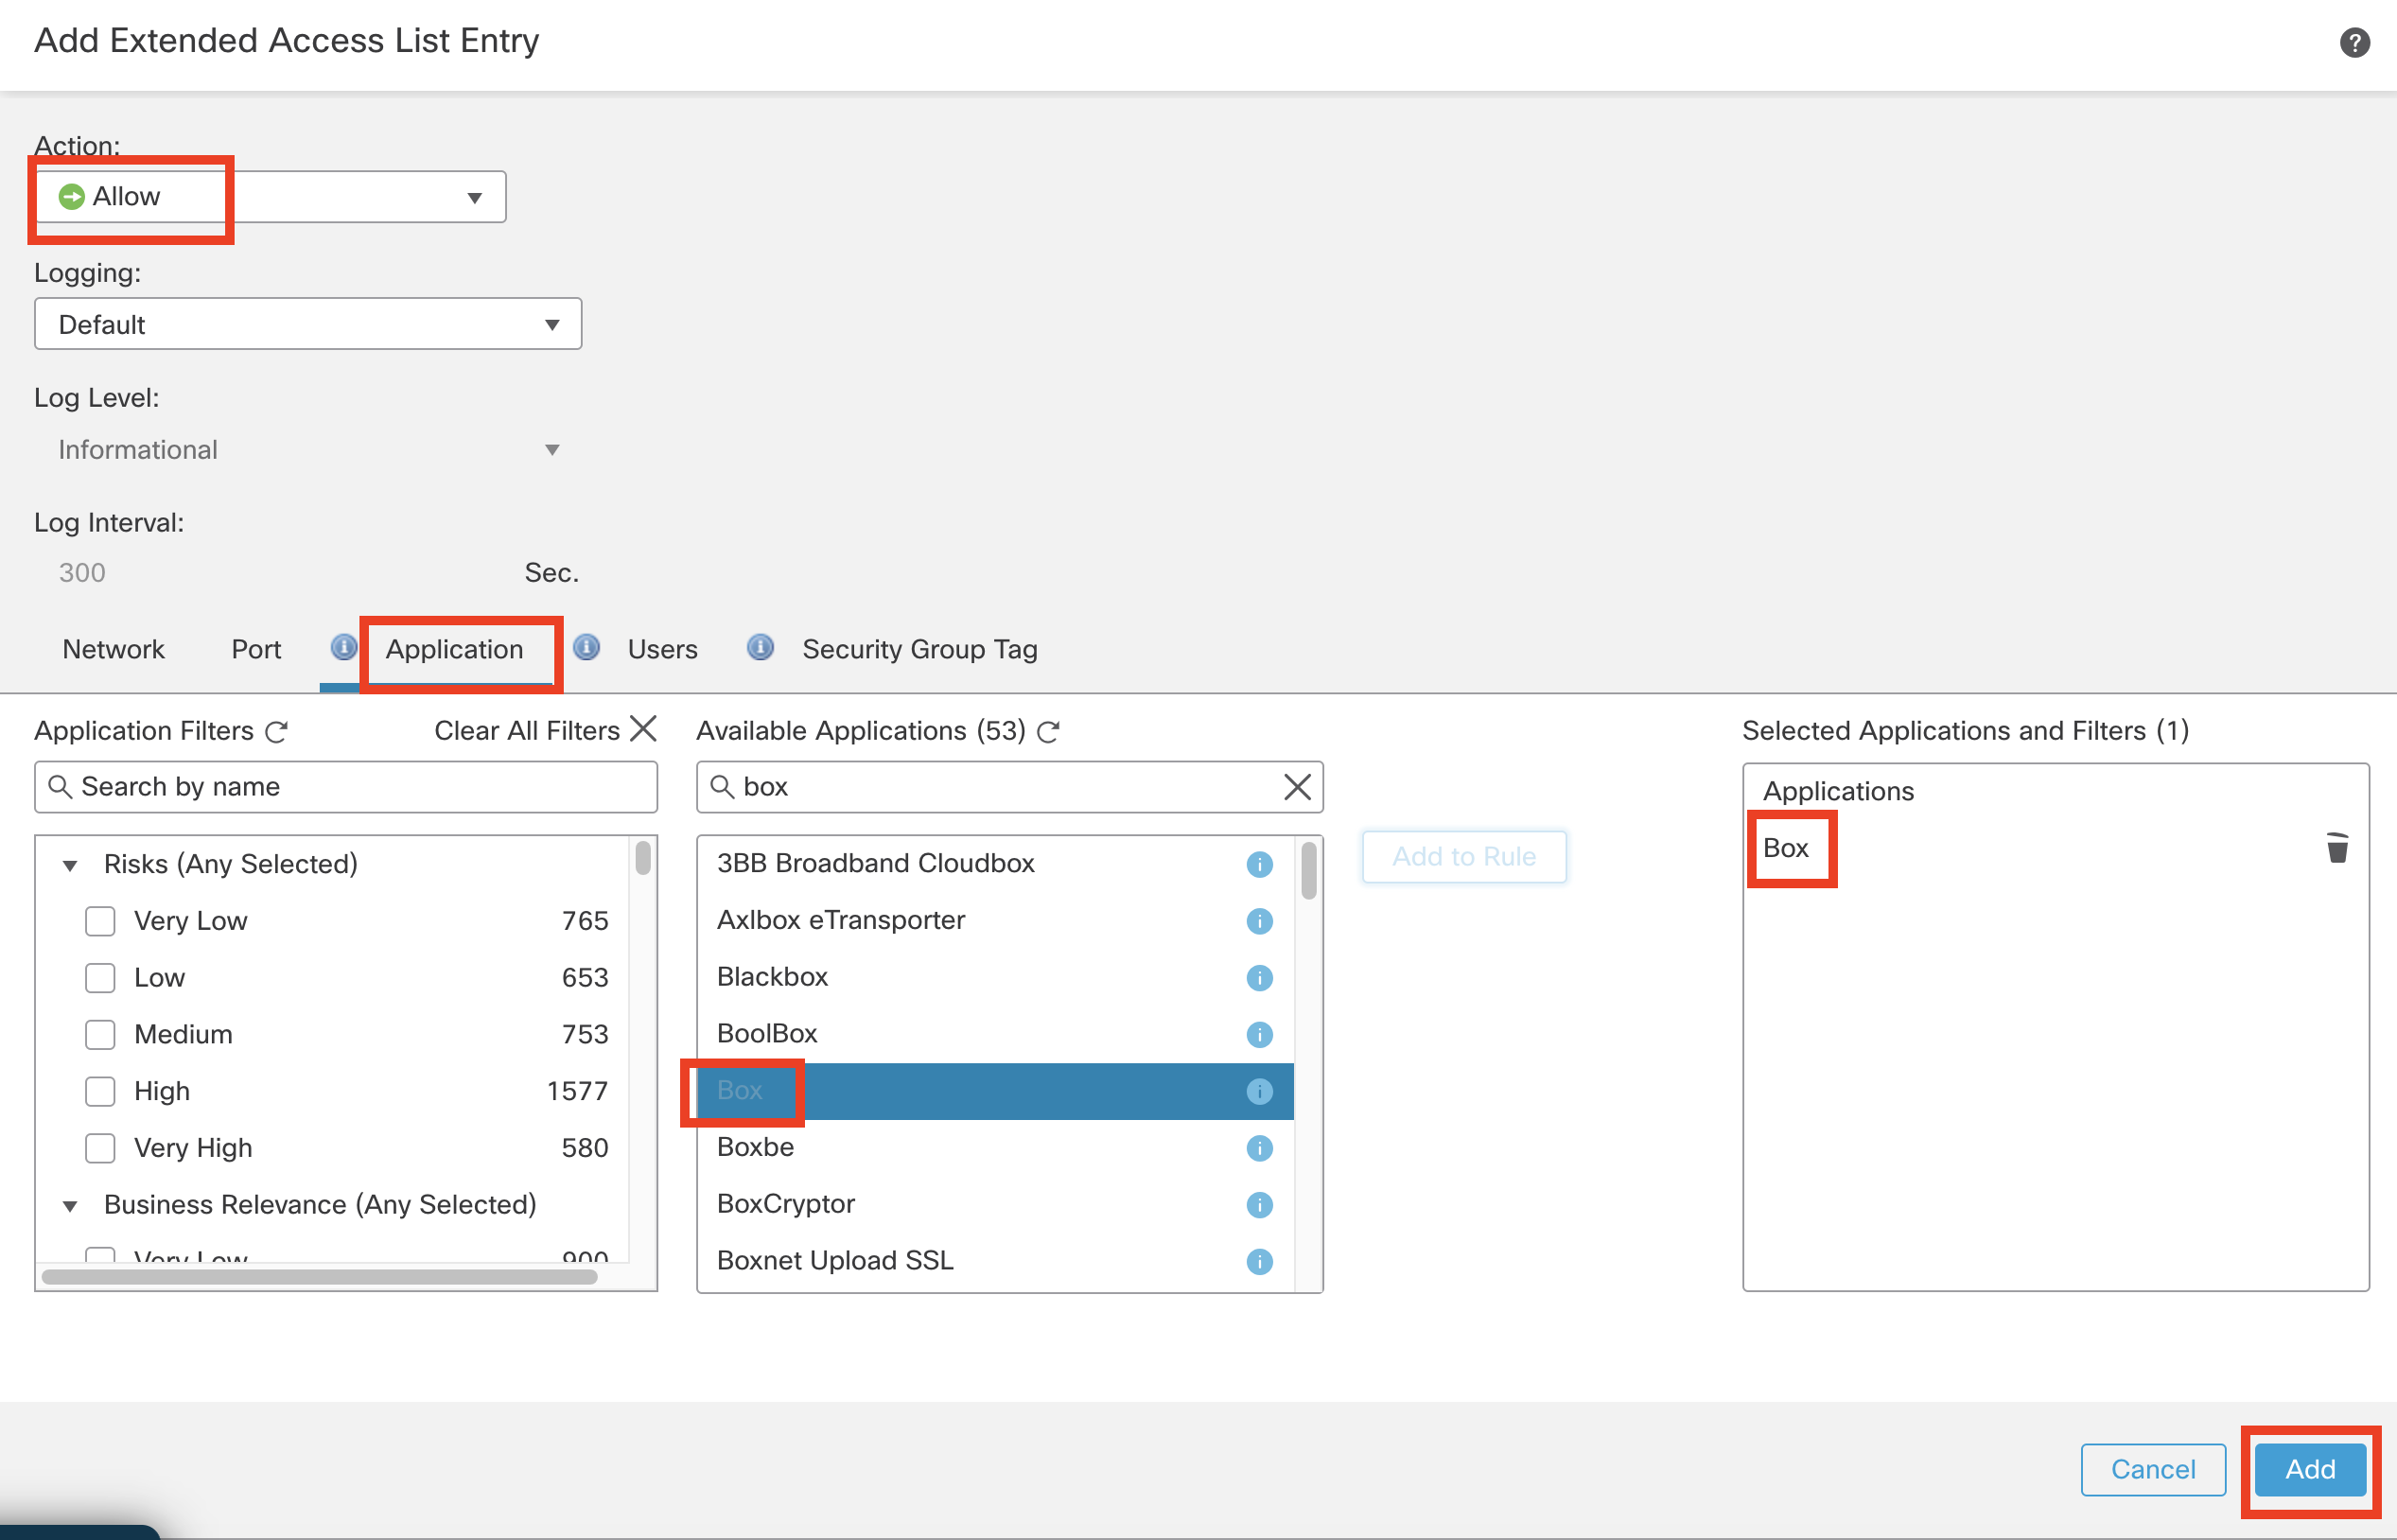
Ensure the Action is set to Allow
-
Click the Application Tab in the Extended Access List Entry
-
Search Box within the Available Applications
-
Select Box and click Add to Rule
-
Click Add to confirm the changes.
-
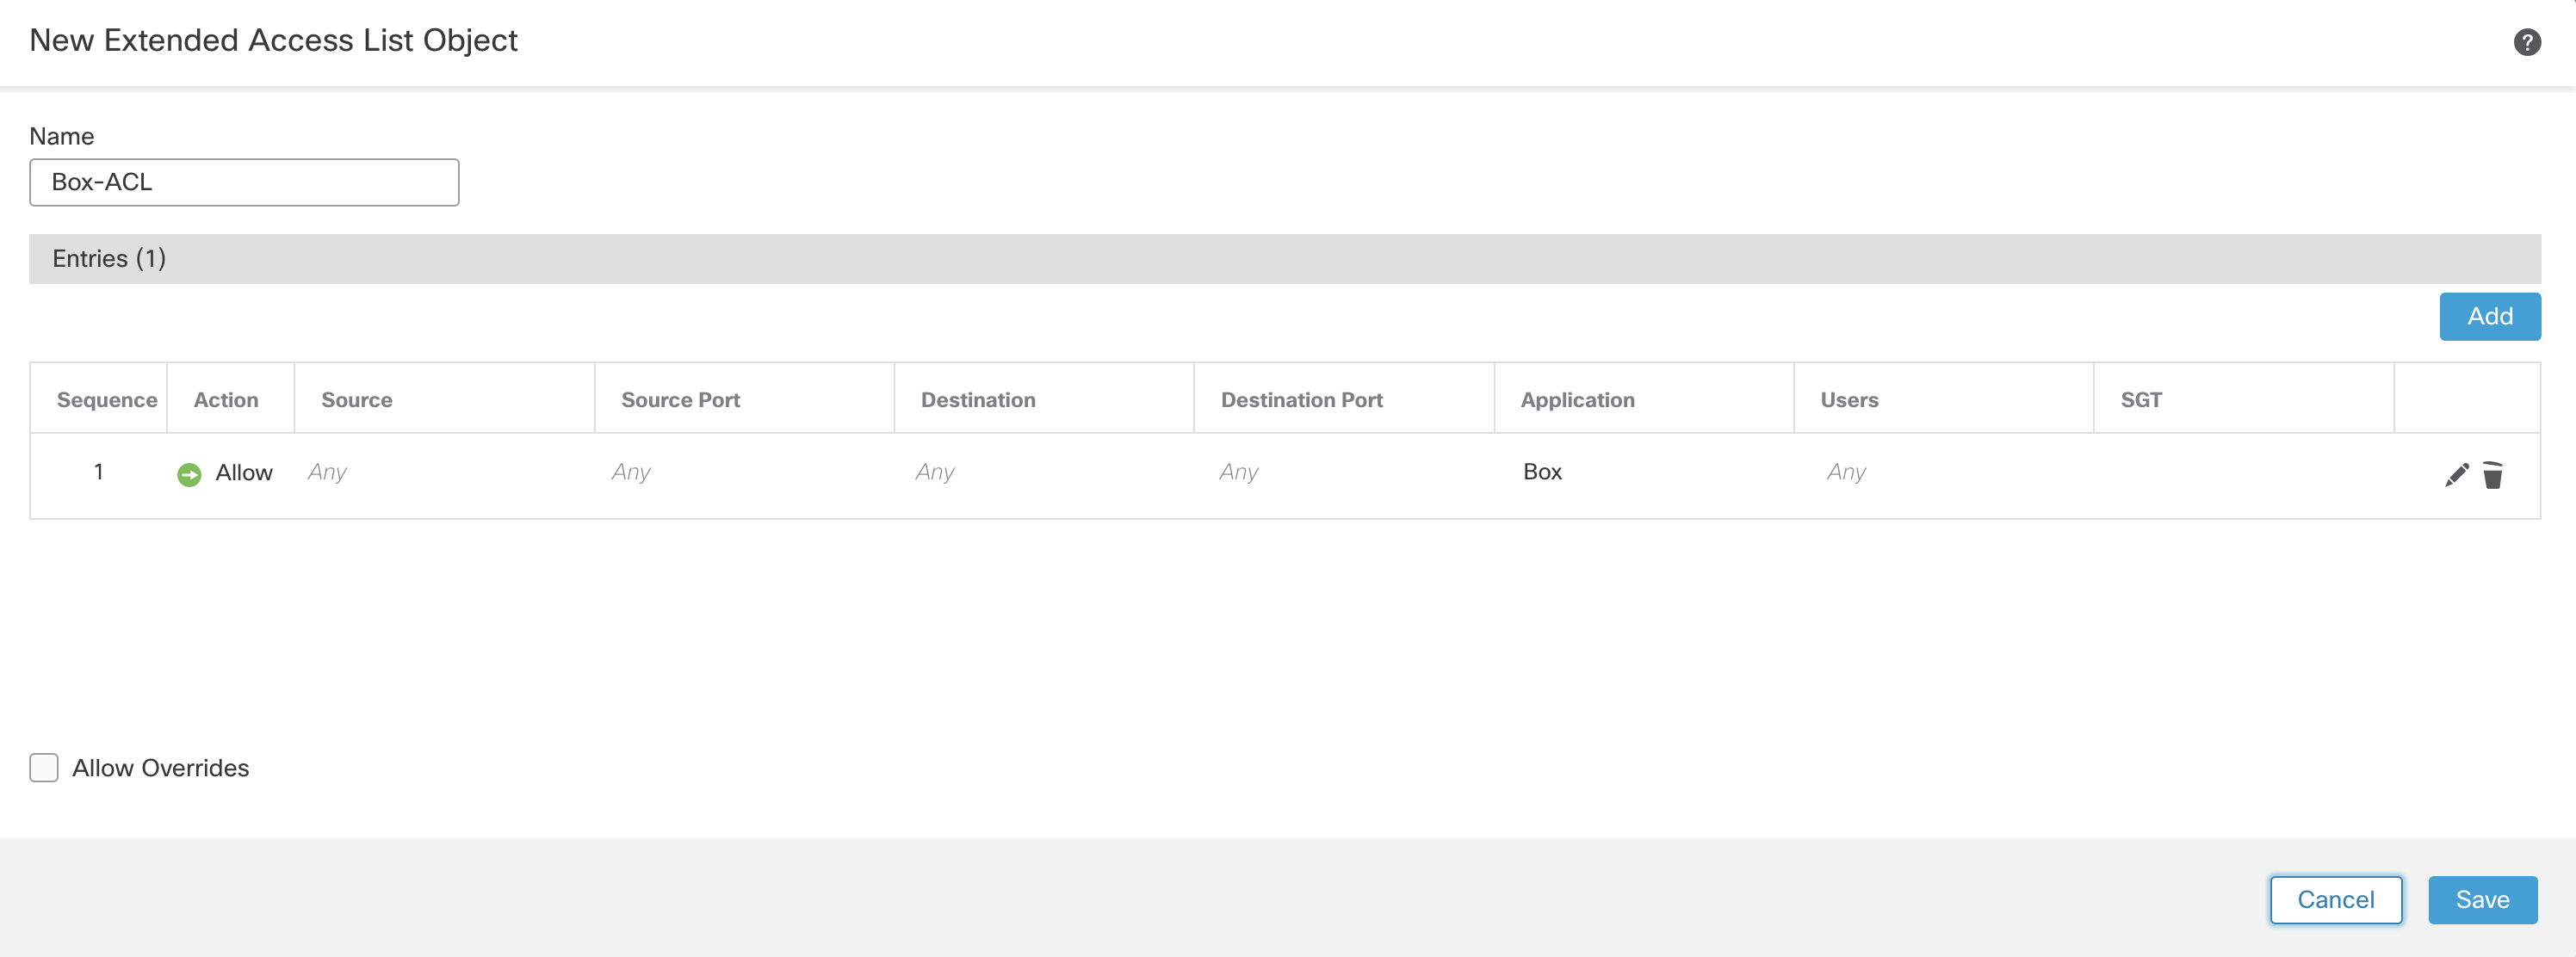
The configured extended list object looks like this:
-
Click Save to save the configuration changes.
Step 4: Configure Extended Access List for Atlassian Application
- Click Add Extended Access List on top again. This time, create an extended access list for Atlassian traffic.
- For name, enter Atlassian-ACL
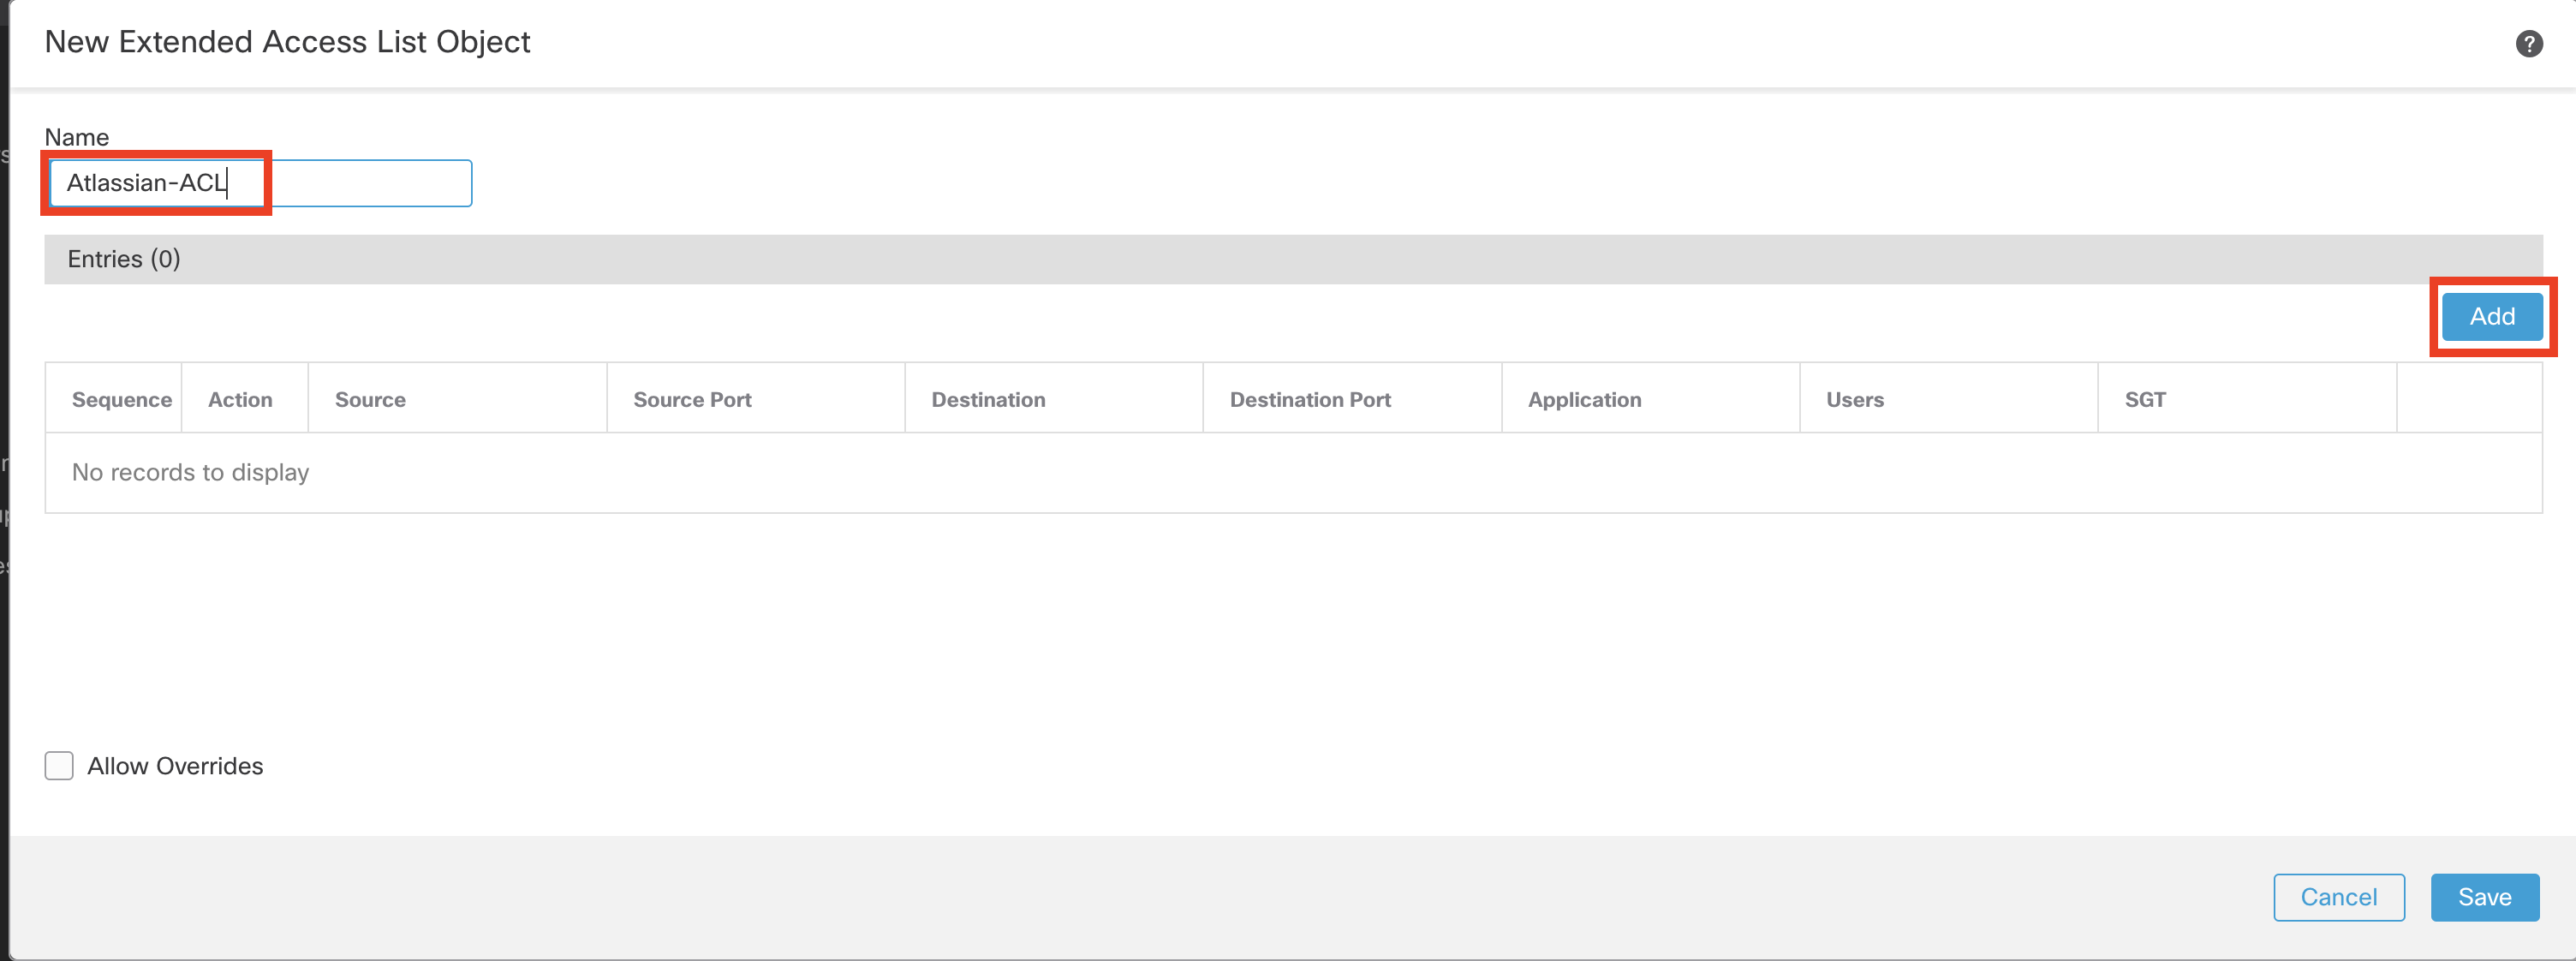
- Click Add
-
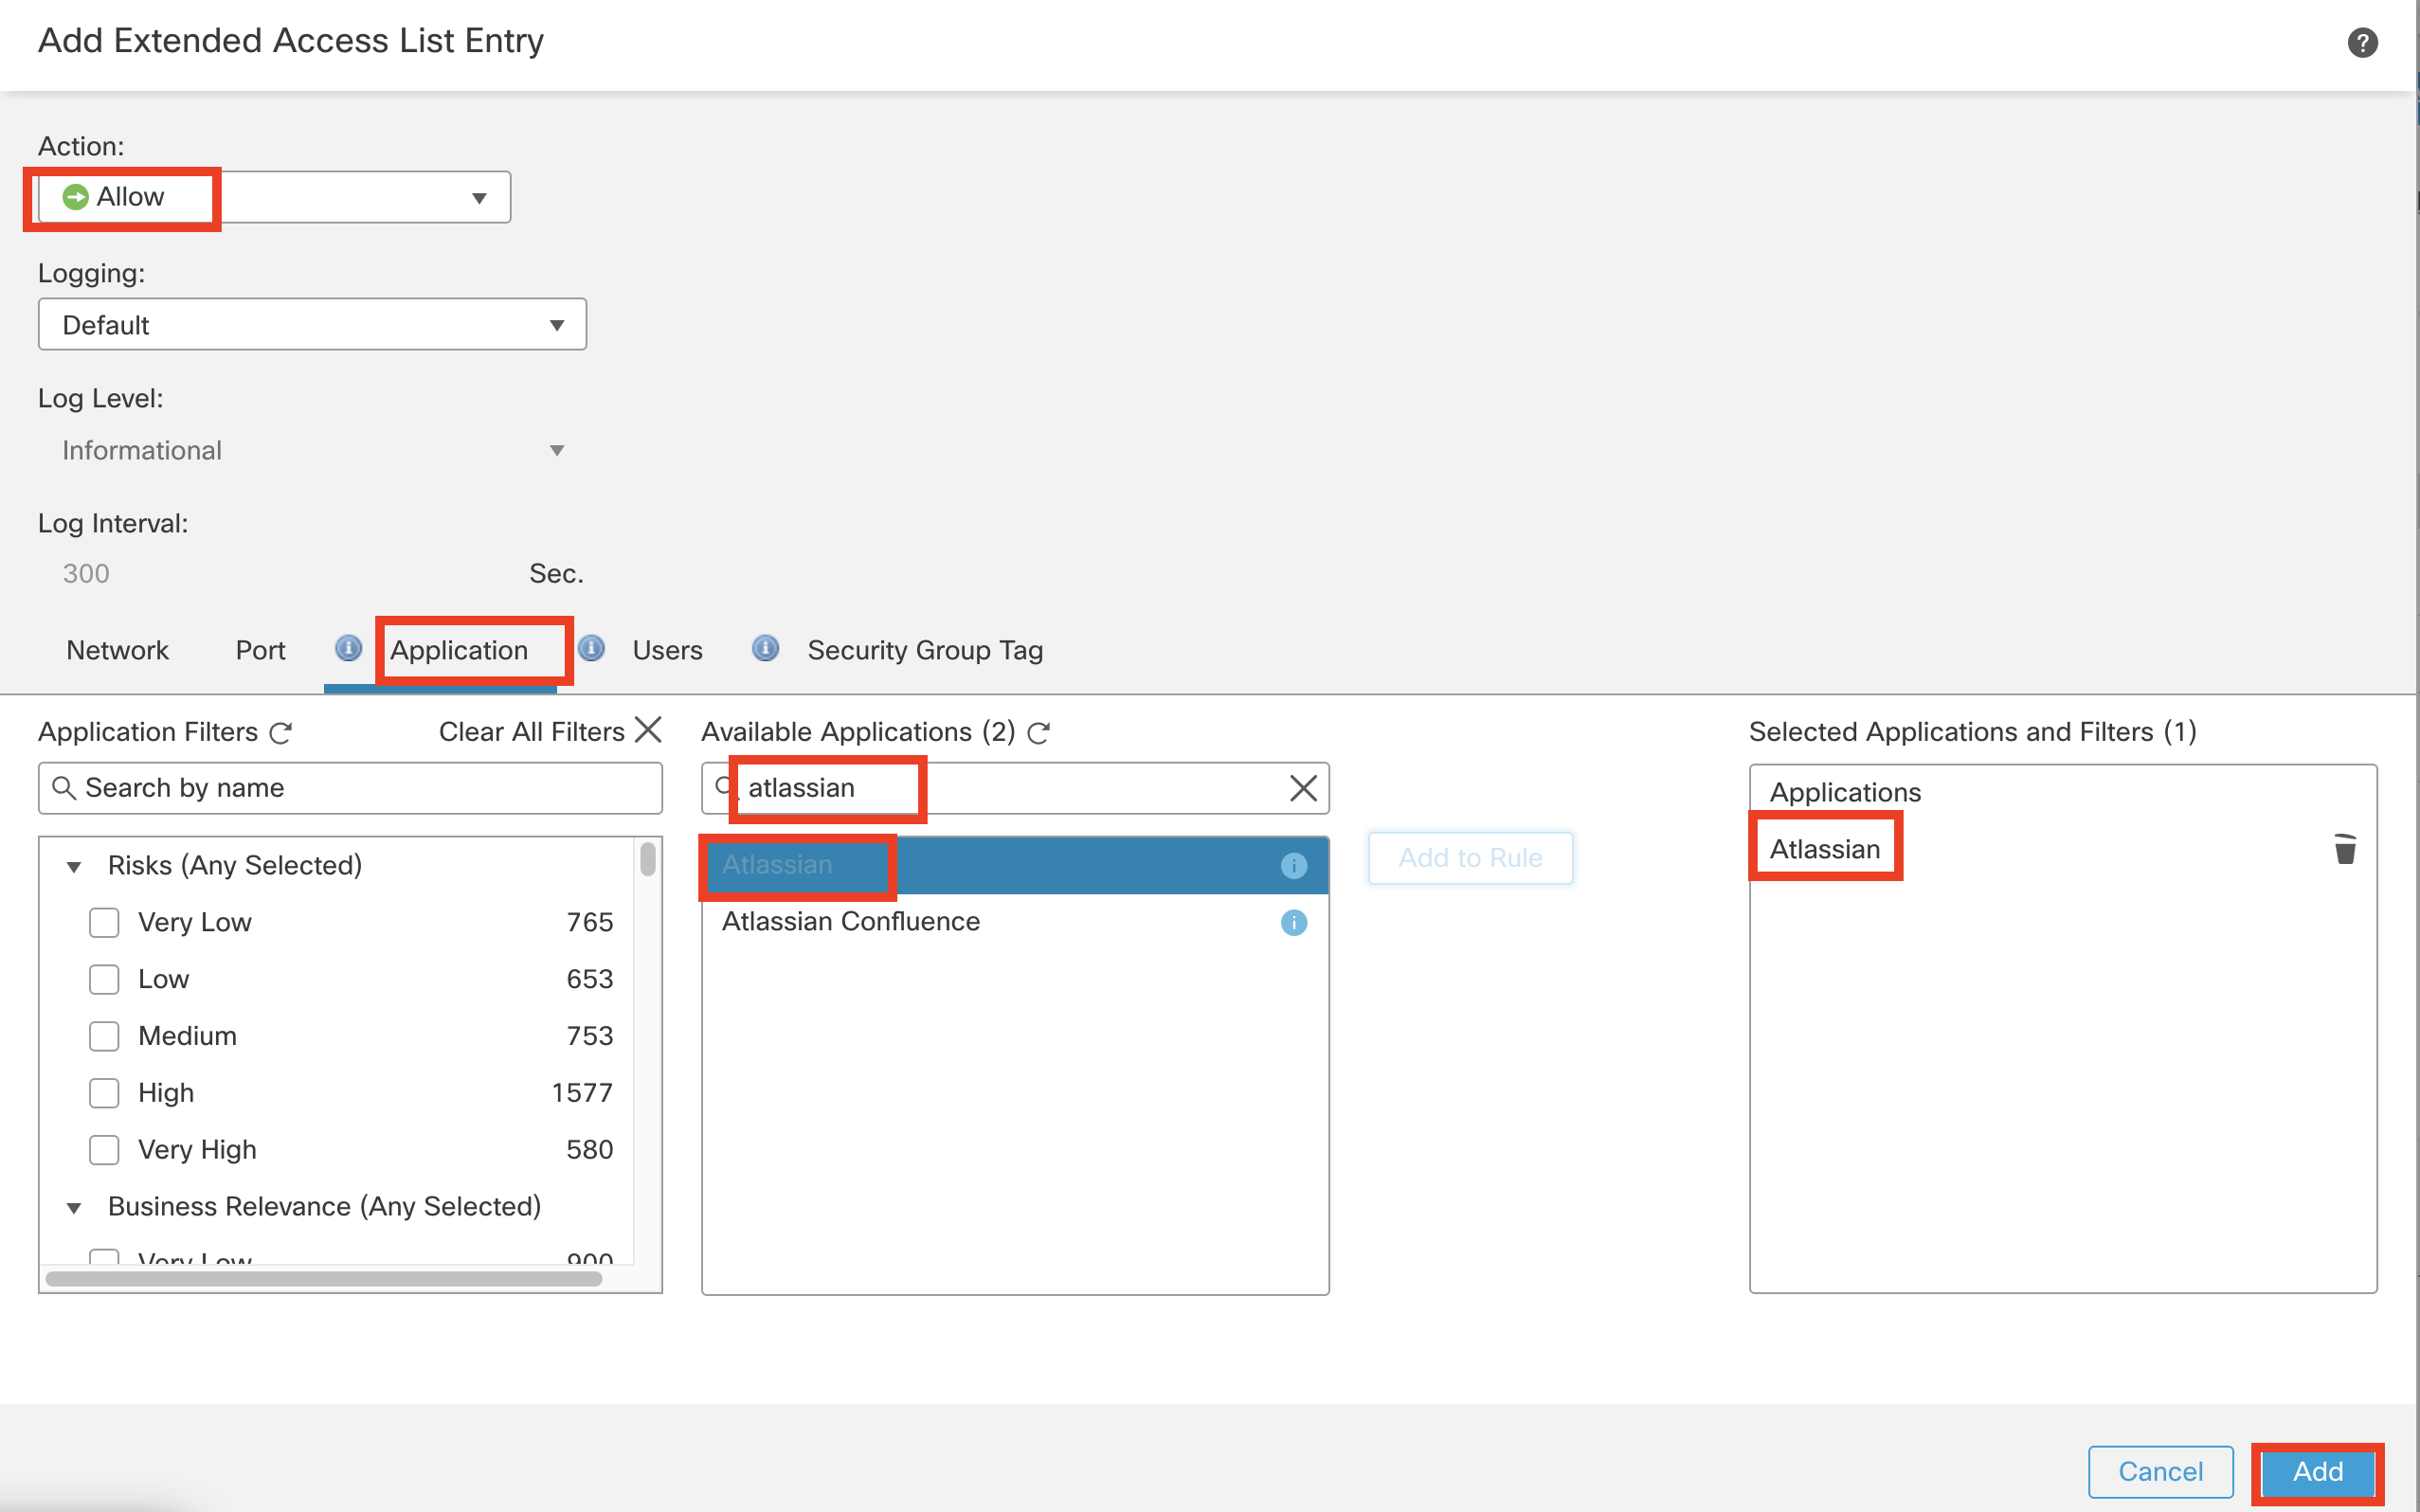
Ensure the Action is set to Allow
-
Click the Application Tab in the Extended Access List Entry
-
Search Atlassian within the Available Applications
-
Select Atlassian and click Add to Rule
-
Click Add to confirm the changes.
-
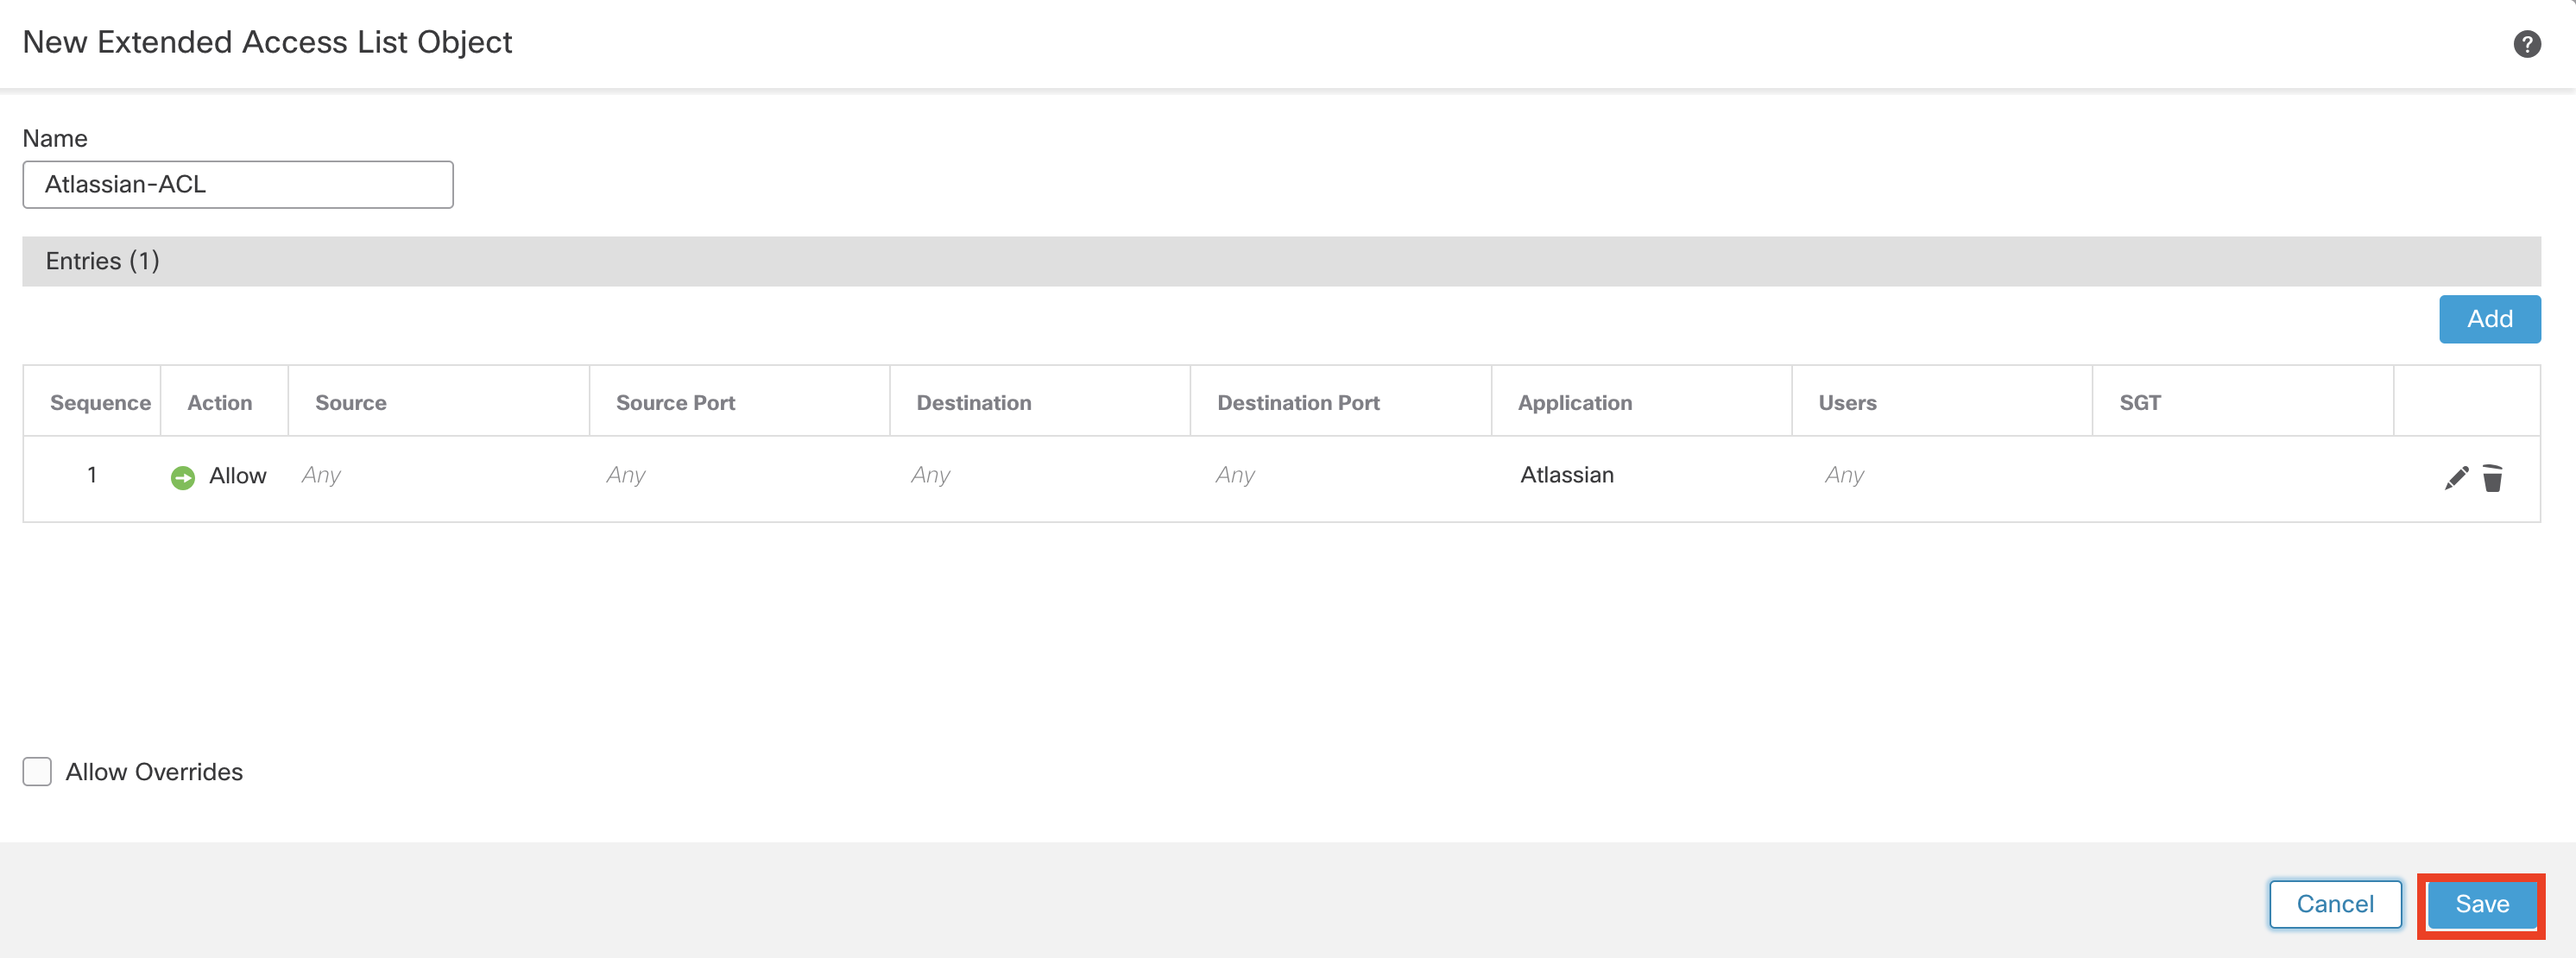
This configured extended list object looks like this:
-
Click Save to write the configuration changes.
Step 5: Configure Extended Access List for Splunk Application
-
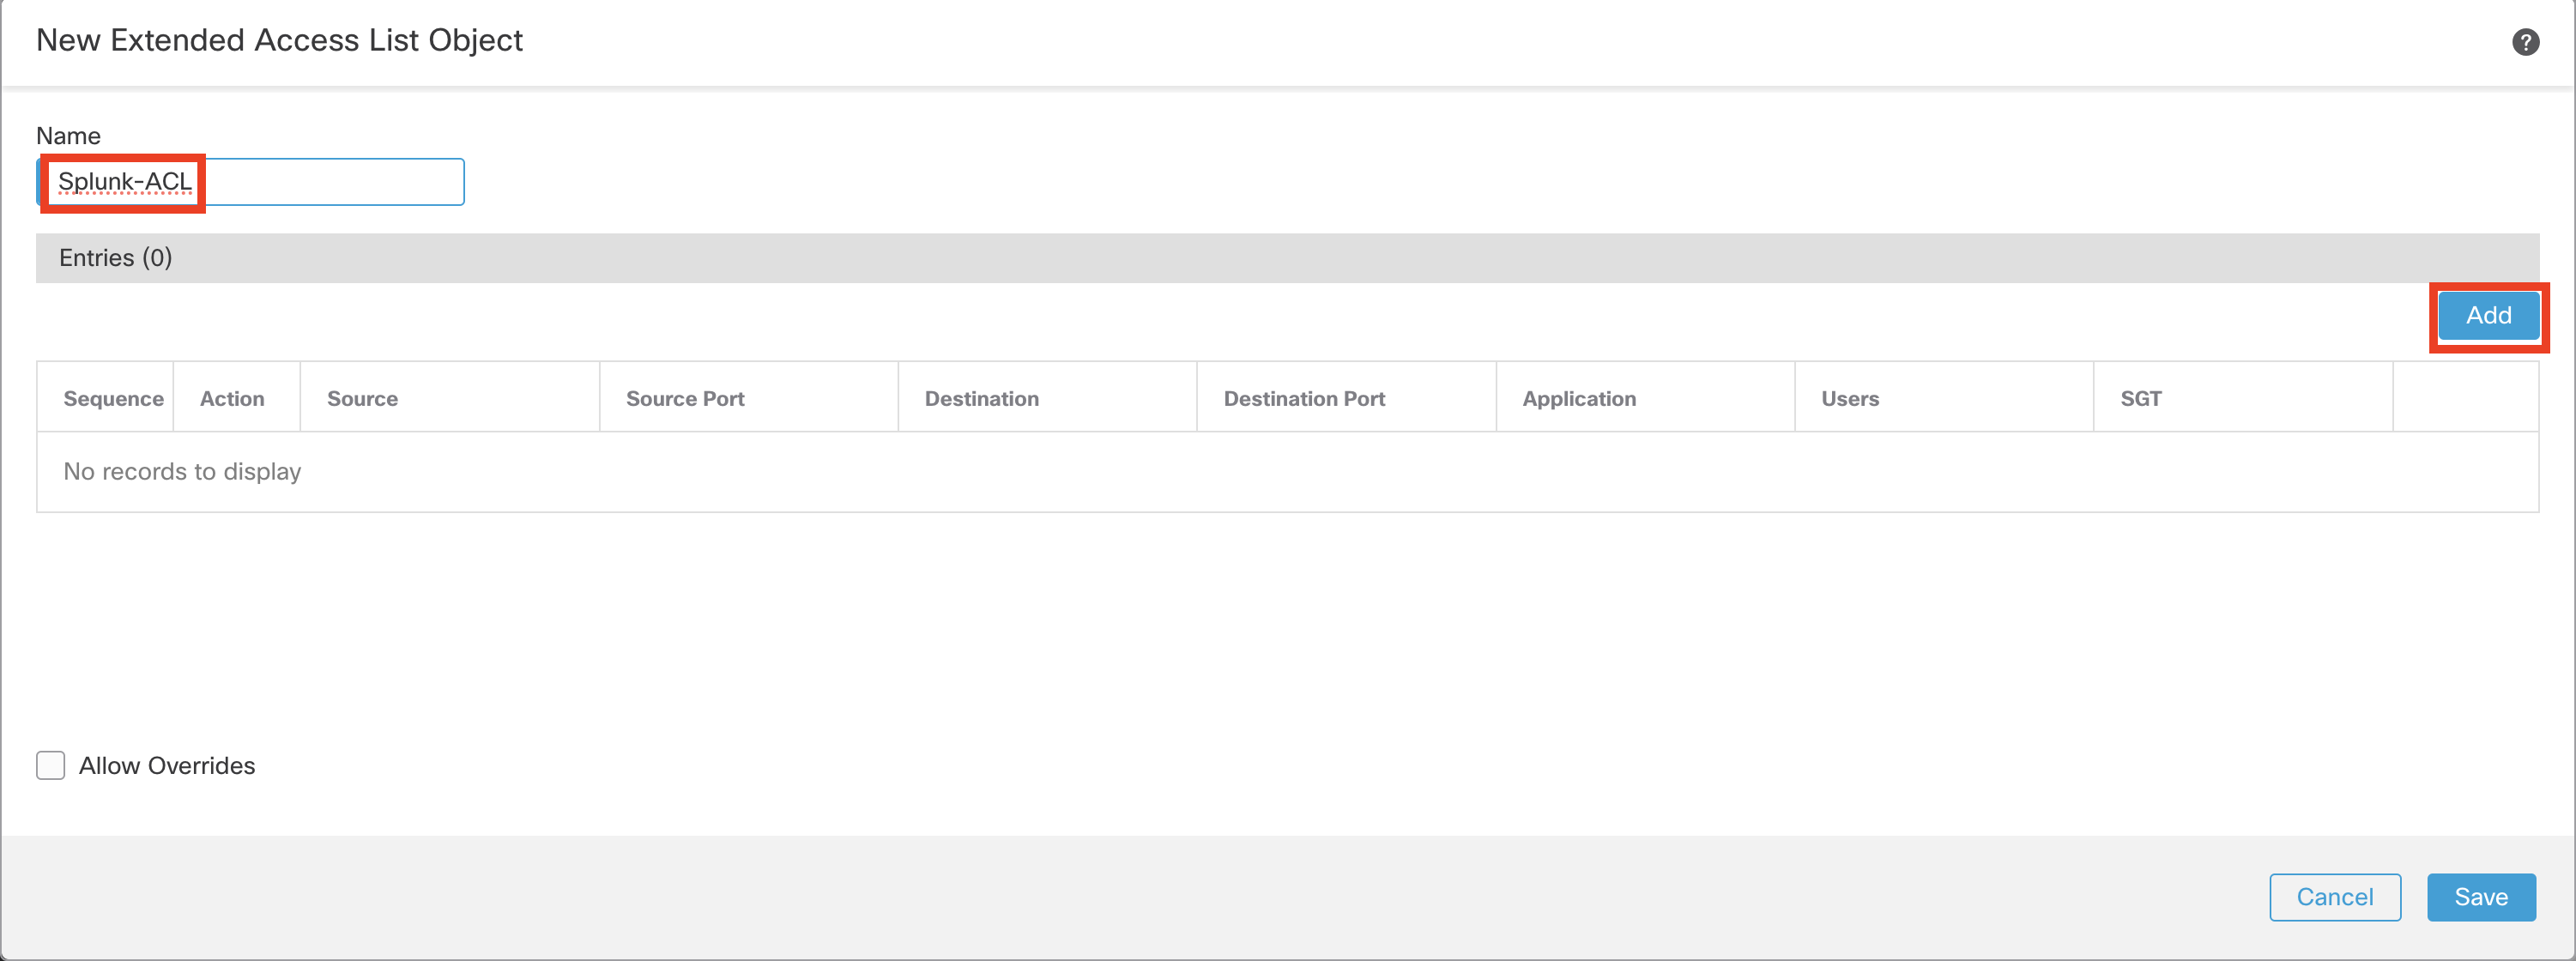
Click Add Extended Access List on top again. This time, create an extended access list for Splunk traffic.
-
For name, enter Splunk-ACL
-
Click Add.
-
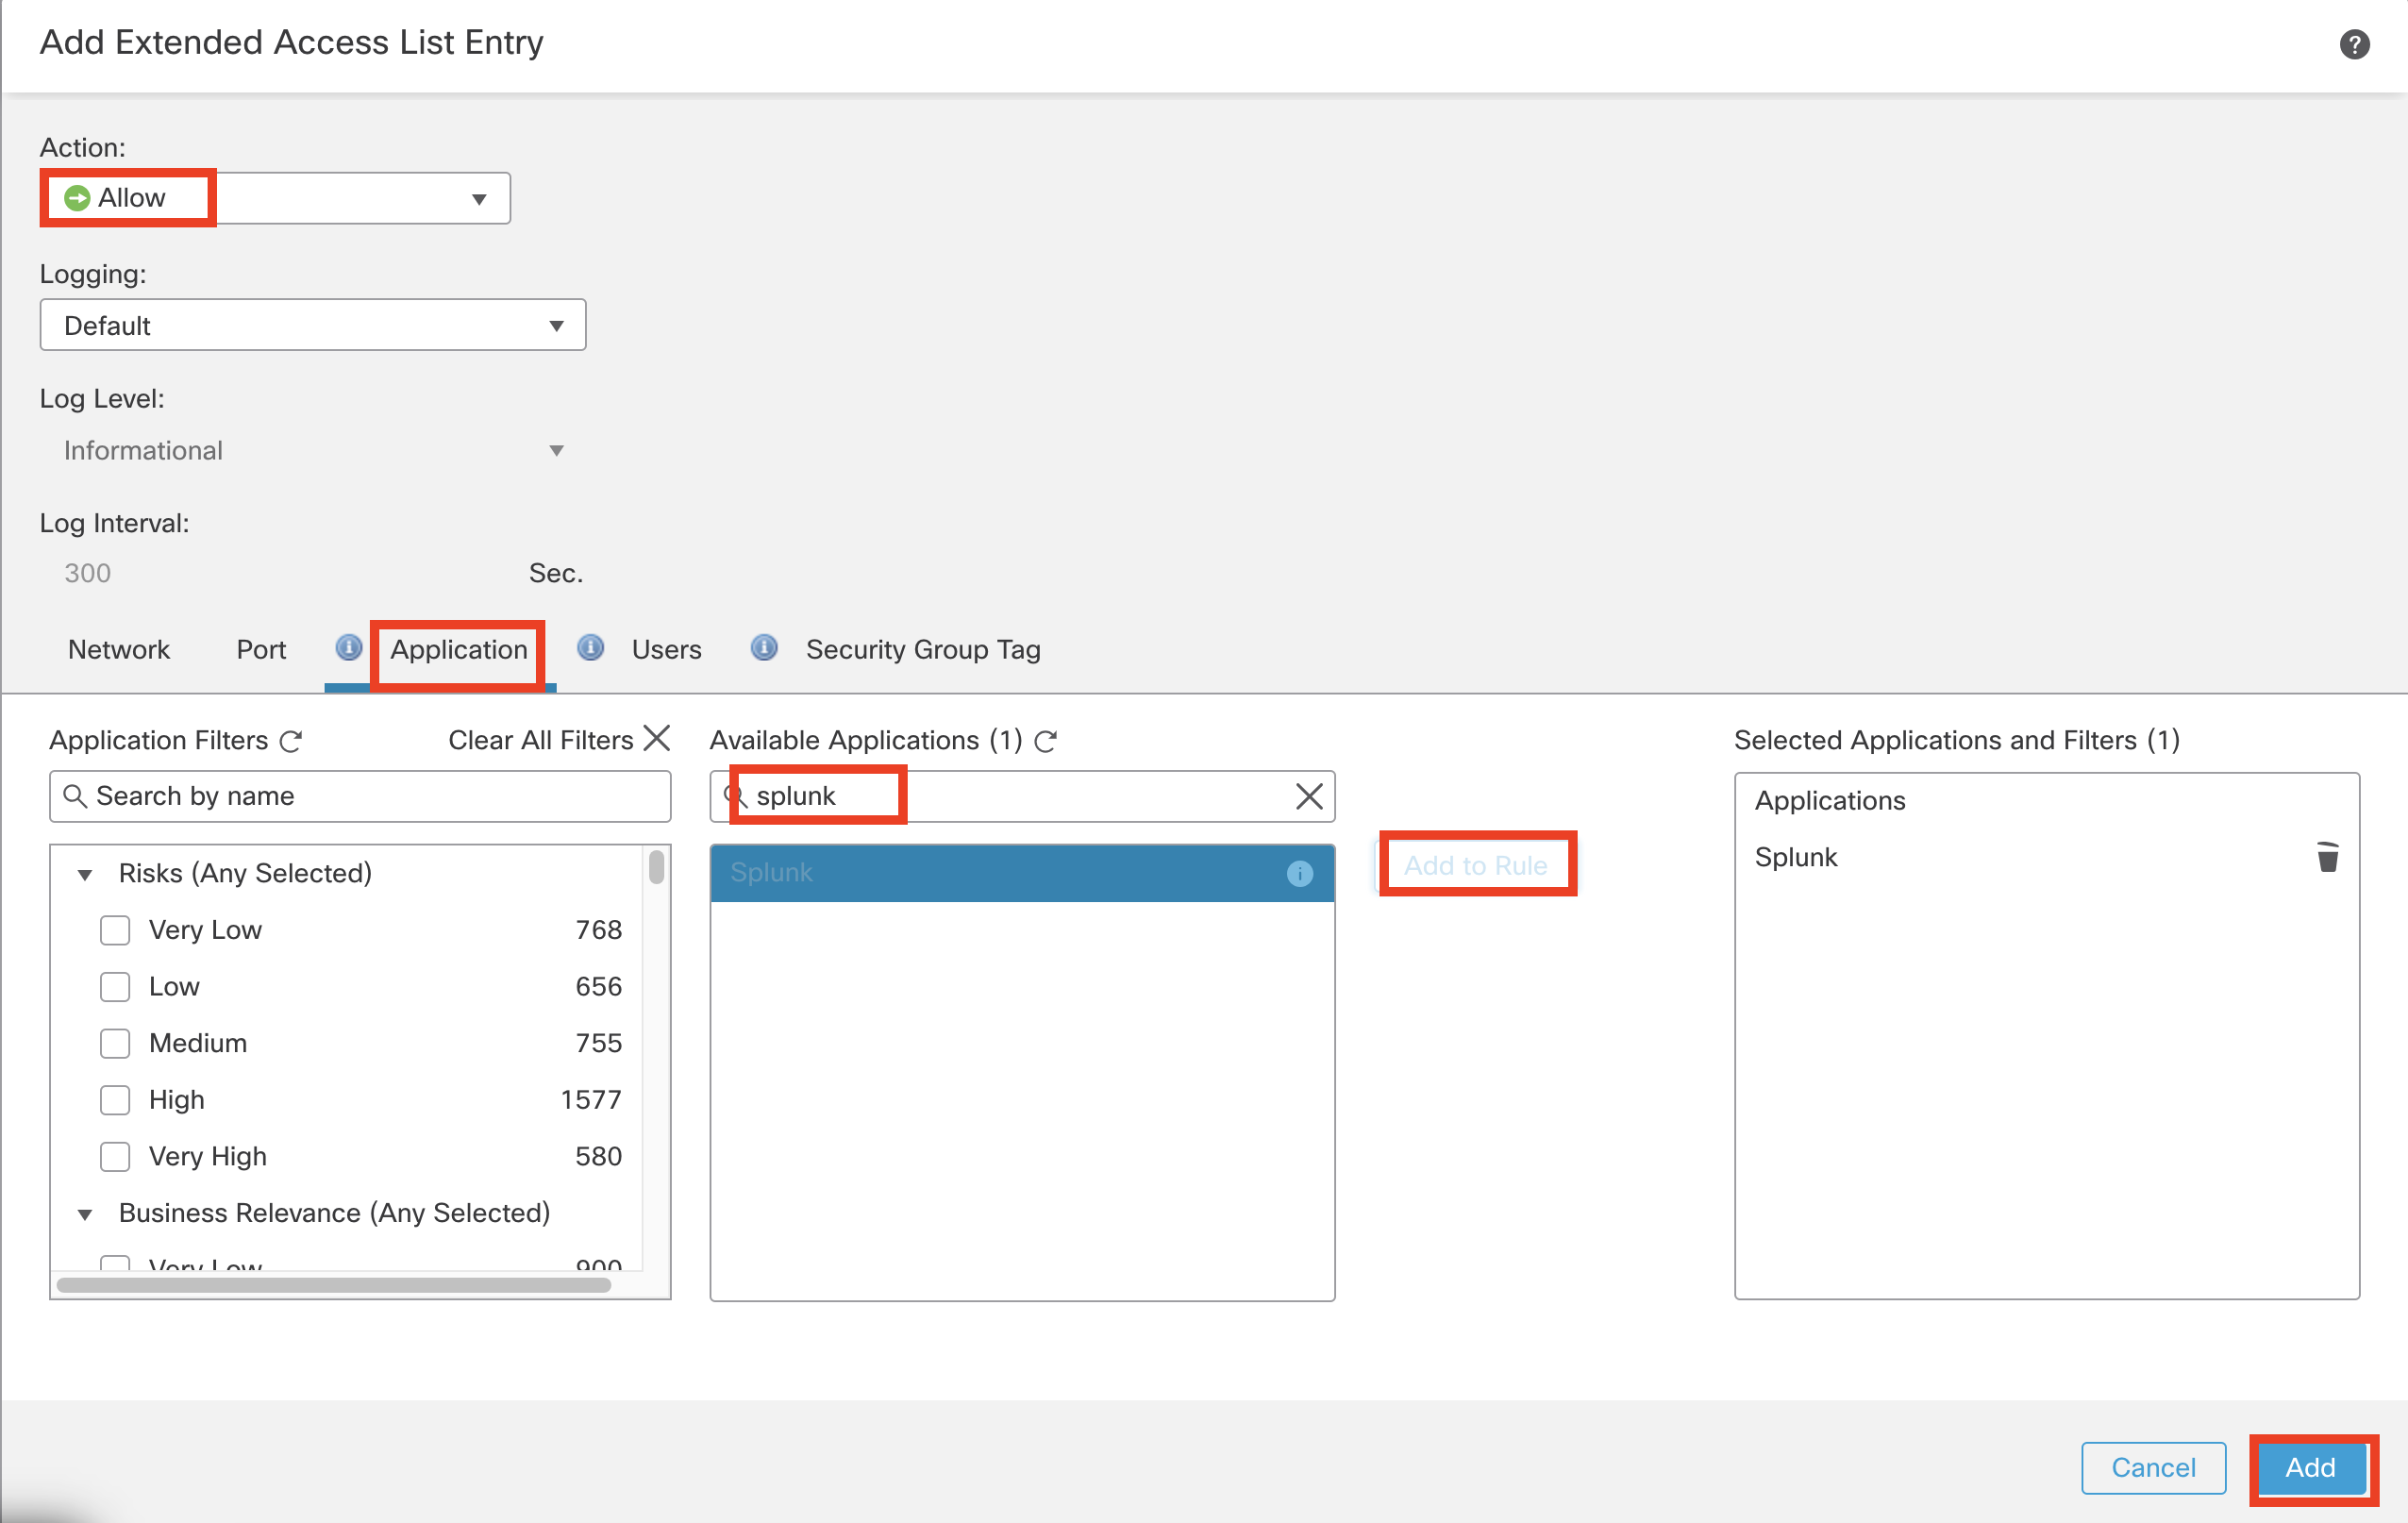
Ensure the Action is set to Allow
-
Click the Application Tab in the Extended Access List Entry
-
Search Splunk within the Available Applications
-
Select Splunk and click Add to Rule
-
Click Add to confirm the changes.
-
This configured extended list object looks like this:
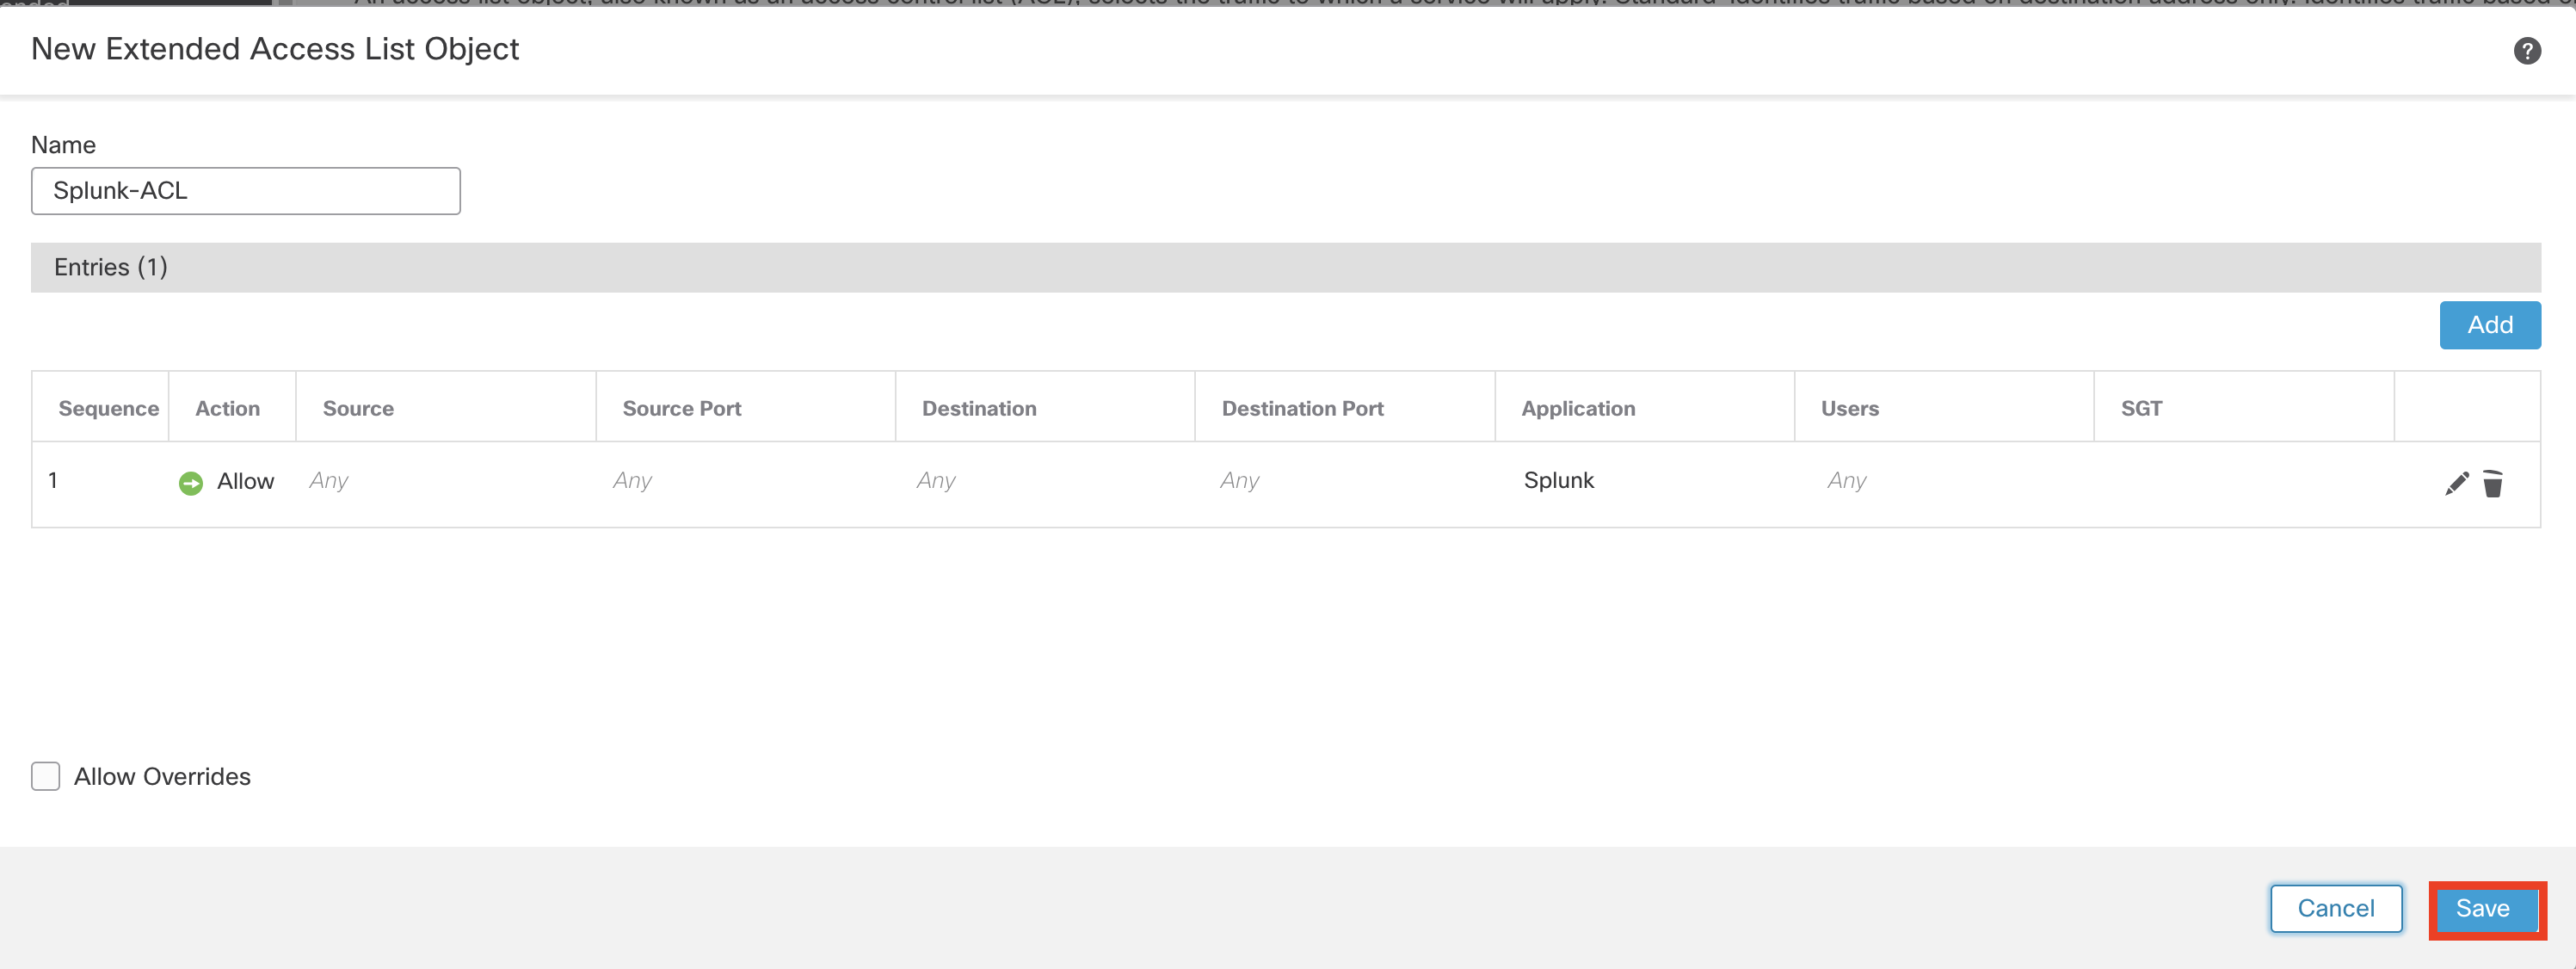
- Click Save to write the configuration changes.
Task 5: Configure Direct Internet Access with Policy Based Routing for Box application
In this task, we will configure Direct Internet Access with Policy Based Routing in the Firewall Management Center (FMC). Wkst2 connects to the internet via NGFW2 through the inside interface. The firewall is configured to allow internet access via two egress interfaces, outside and outside2.
Policy Based Routing configuration comprises of three parts:
- Ingress Interface Selection:
Defines the incoming interface from which traffic will be received. - Application Detection:
Defines the extended access list which determines the particular application traffic that will be routed as per the configured rules. - Forwarding Actions:
Defines the criteria through which above selected application traffic will be routed.
The below steps define how routing is configured to send the Box application traffic through outside2 interface because of the lesser value of interface priority configured on that interface.
- In the FMC, navigate to Devices > Device Management.
- Click on the pencil icon on the far right side of NGFW2.
- The interface view shows up. Click on the Routing tab.
- Click Policy Based Routing.
- Click Add.
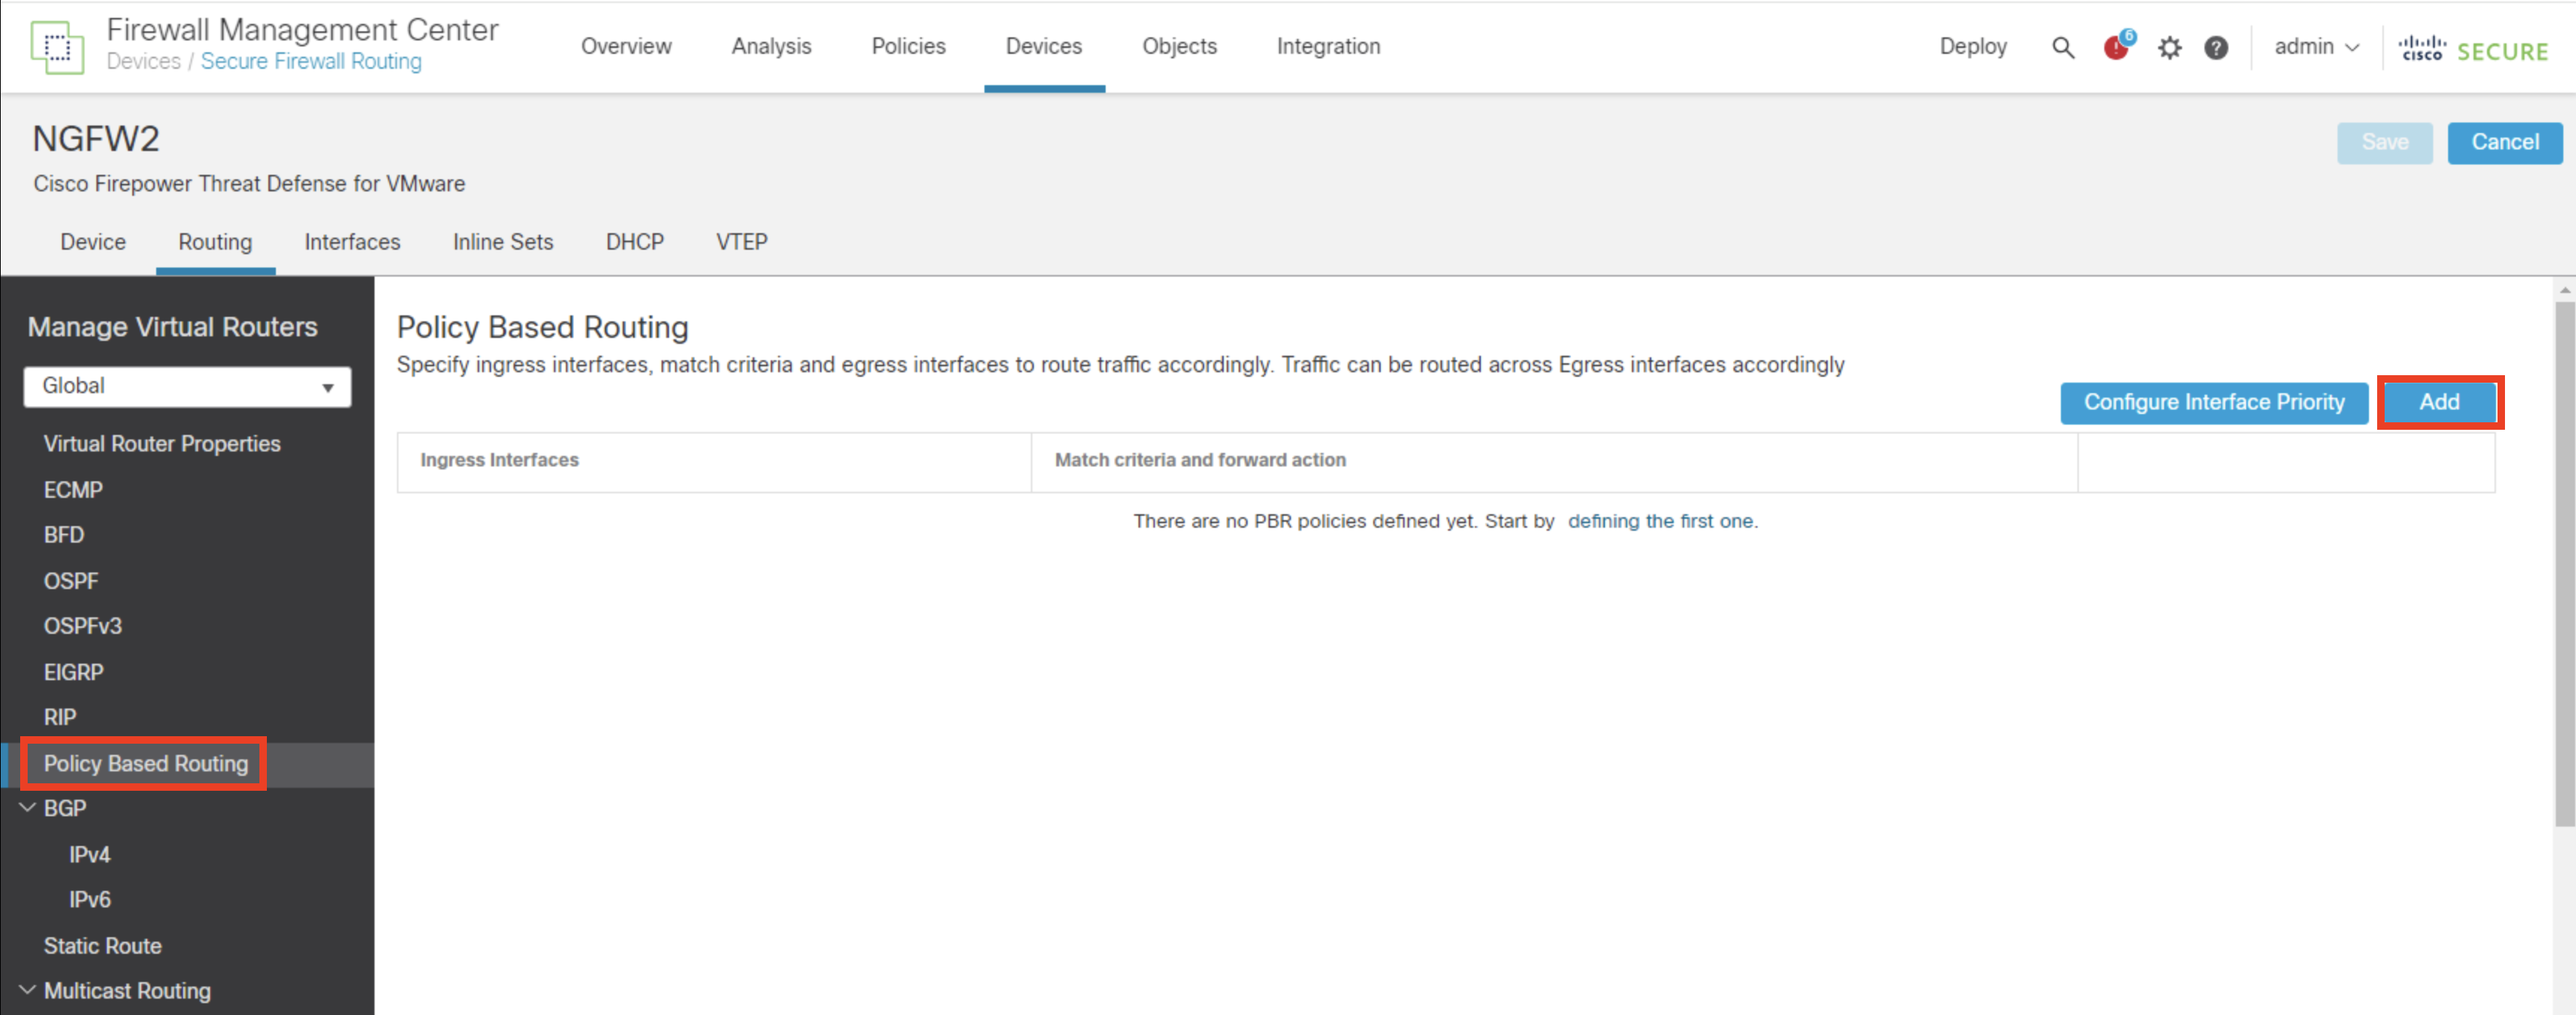
- From the Ingress Interface dropdown menu, select inside interface
- Click Add to configure Match Criteria and Egress Interface (Forwarding action)
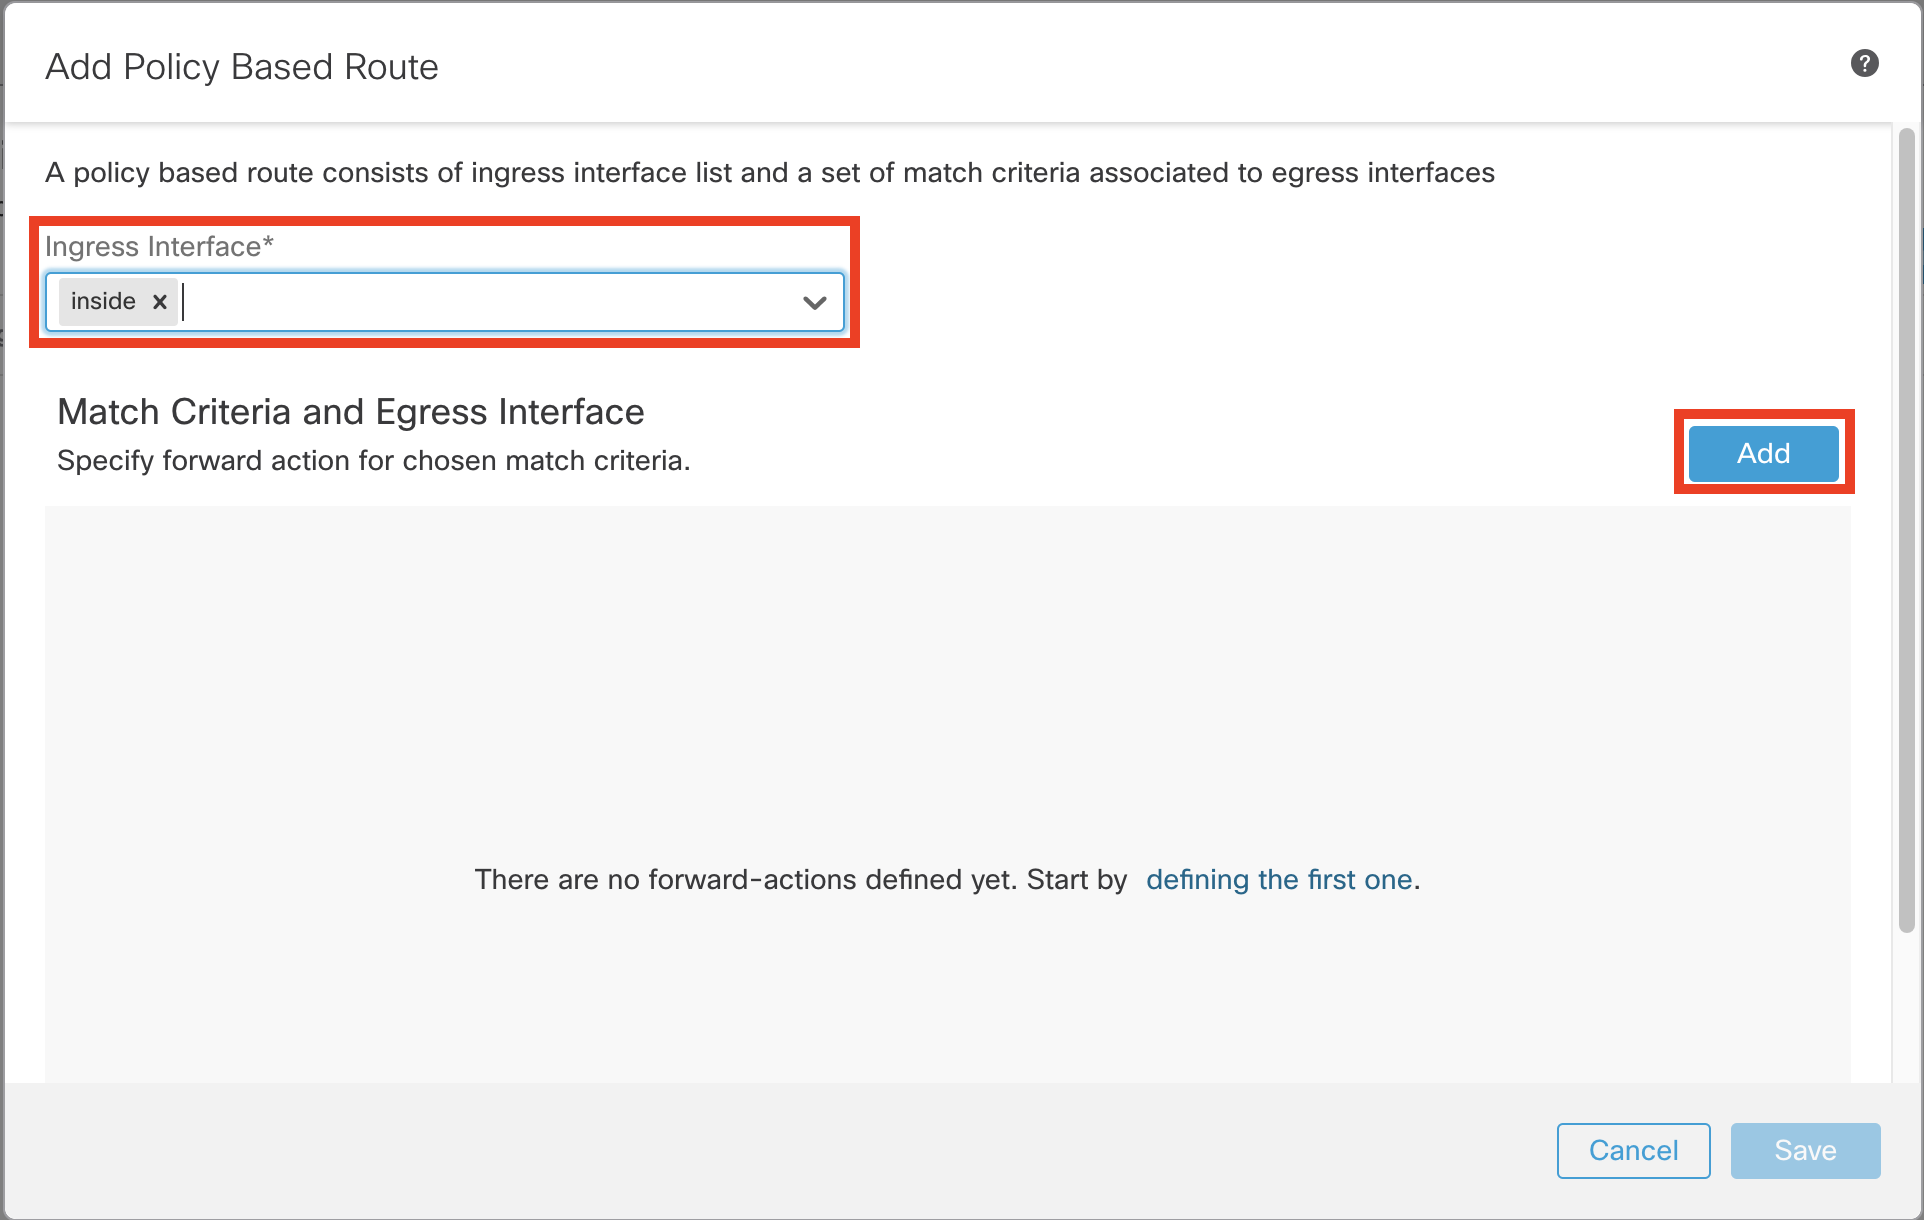
- From the Match ACL dropdown menu, select Box-ACL
- Ensure the setting for Send To field is set as Egress Interfaces
- Ensure the setting for Interface Ordering is set as Interface Priority
- From Available Interfaces, click + icon adjacent to outside and outside2 interface to move them to Selected Egress Interfaces
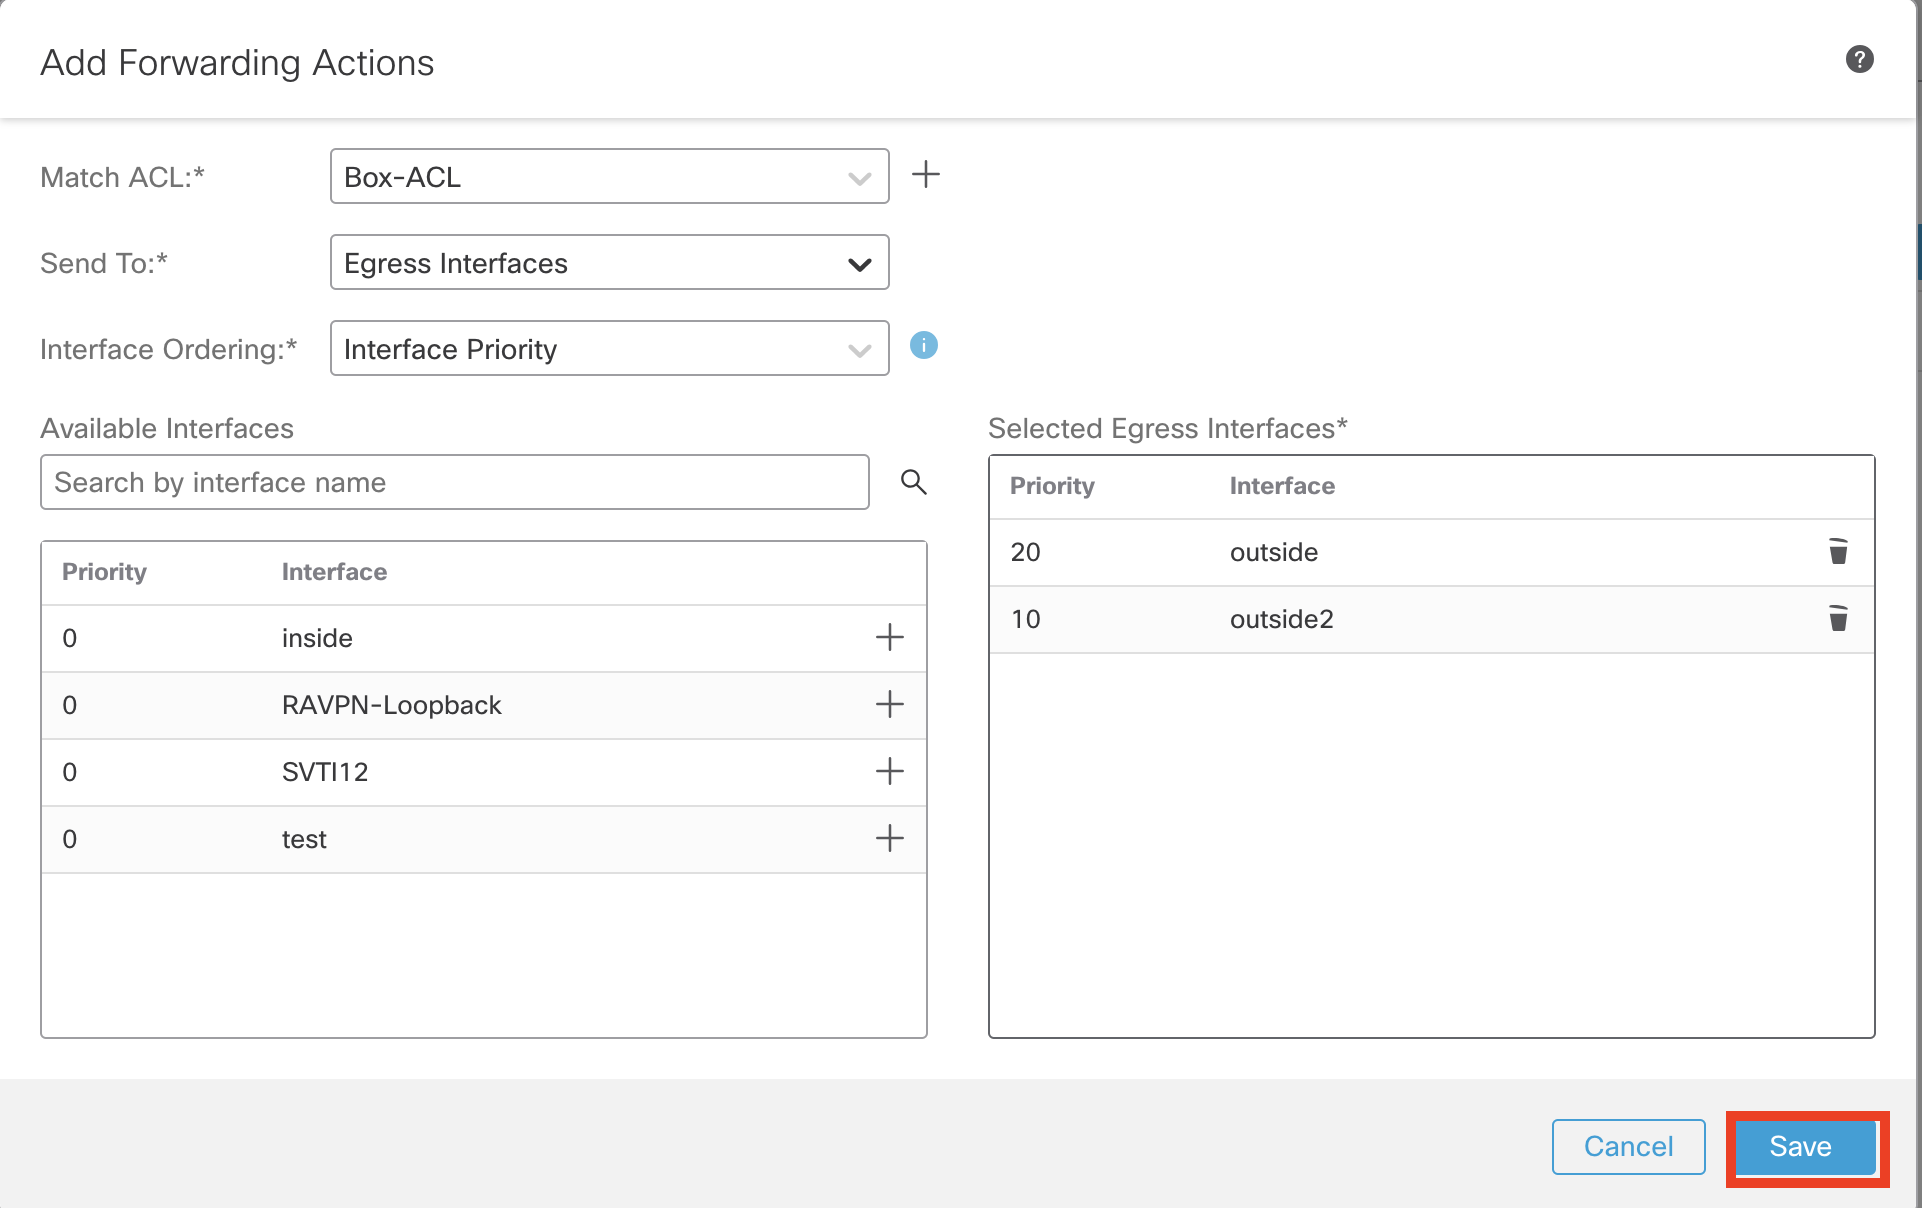
- Click Save
- Complete policy based routing rule looks as shown below.
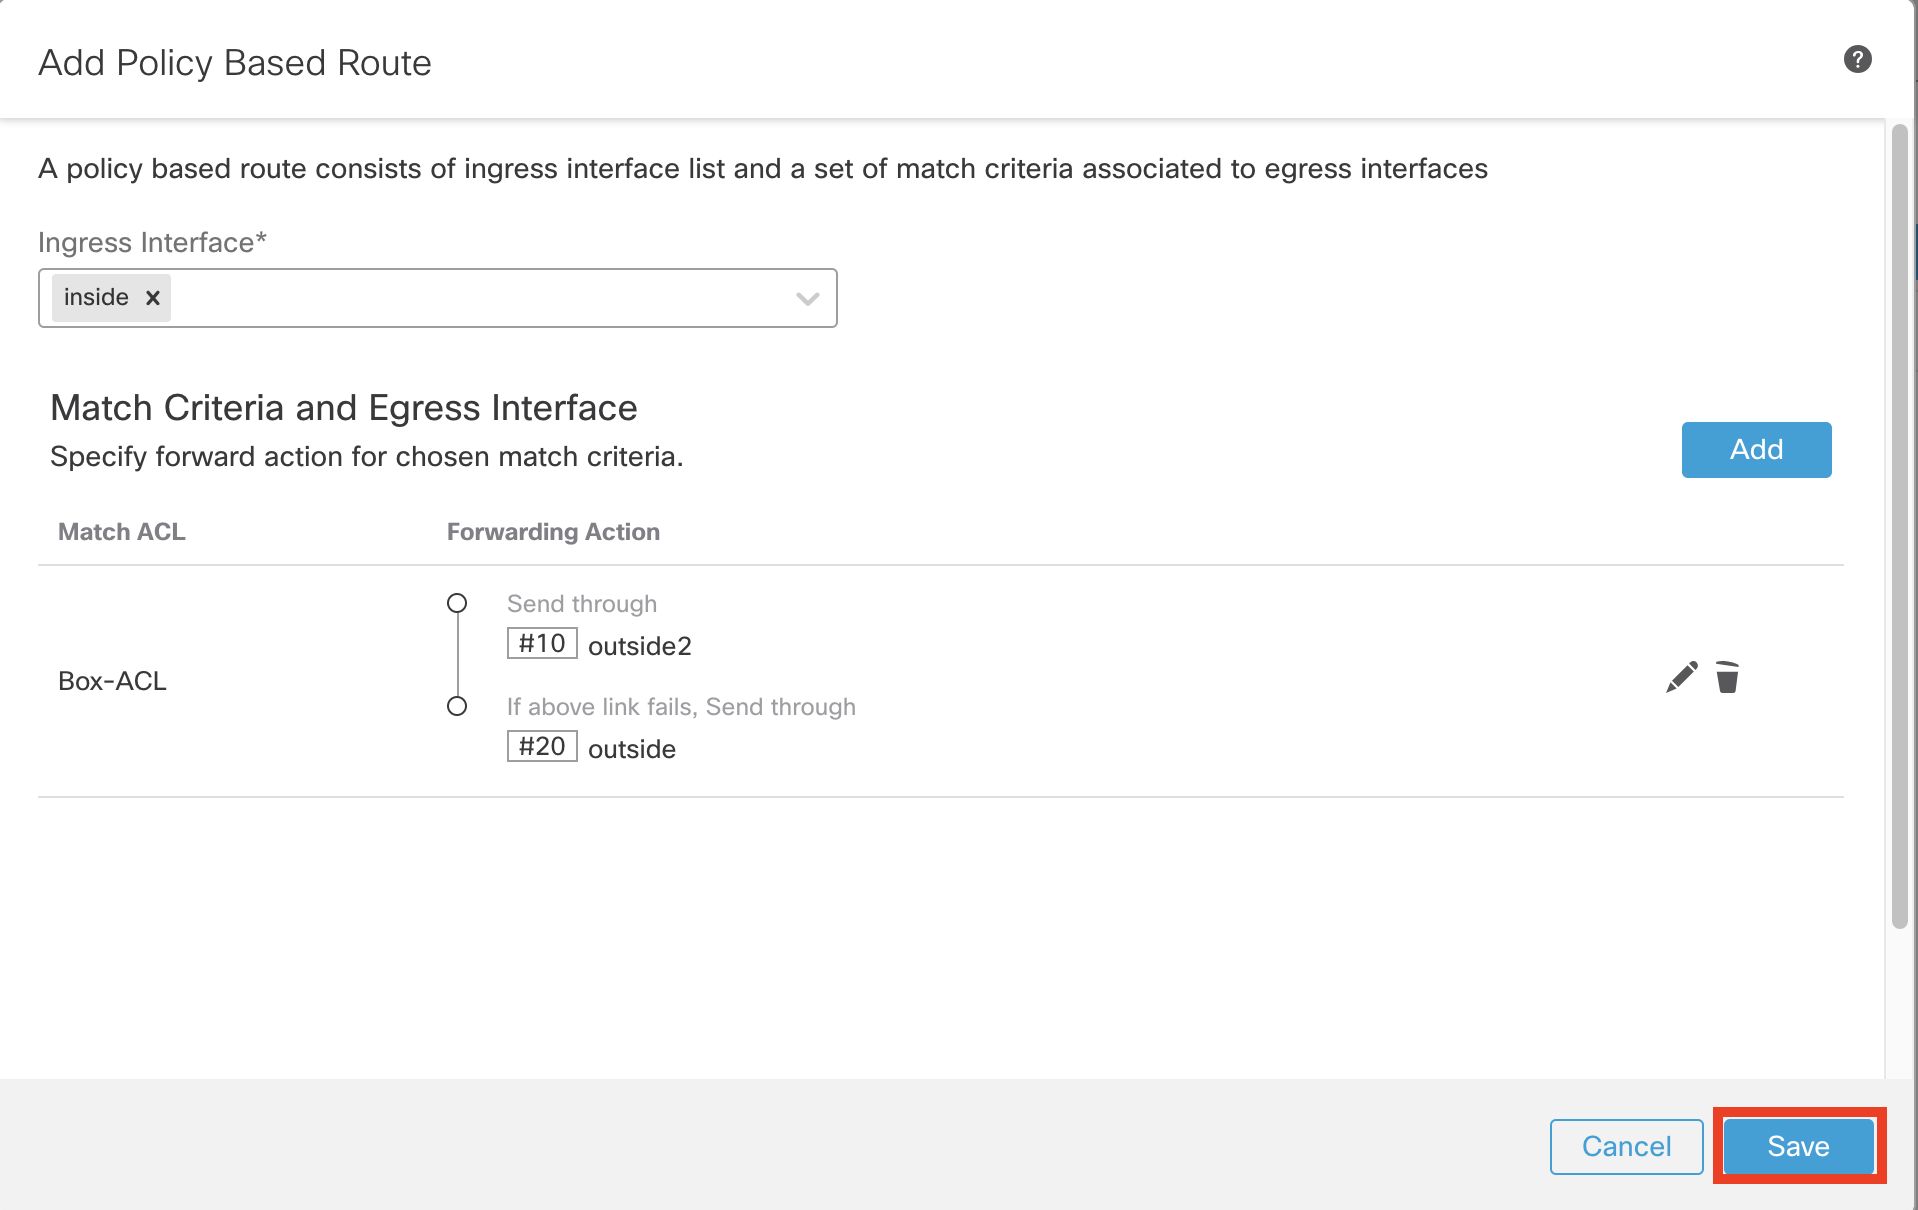
- Click Save
- Click Save on the top right to save the changes.
Task 6: Configure Path Monitoring for Policy Based Routing
In this task, path monitoring for all the egress interfaces is enabled to collect their performance metrics (RTT, jitter, packet-lost, and MOS) and then use these metrics to determine the best path (egress interface) for forwarding the traffic.
Step 1: Enable Path Monitoring
- Click on the Interfaces tab.
- Click on the Pencil icon on far right of outside interface
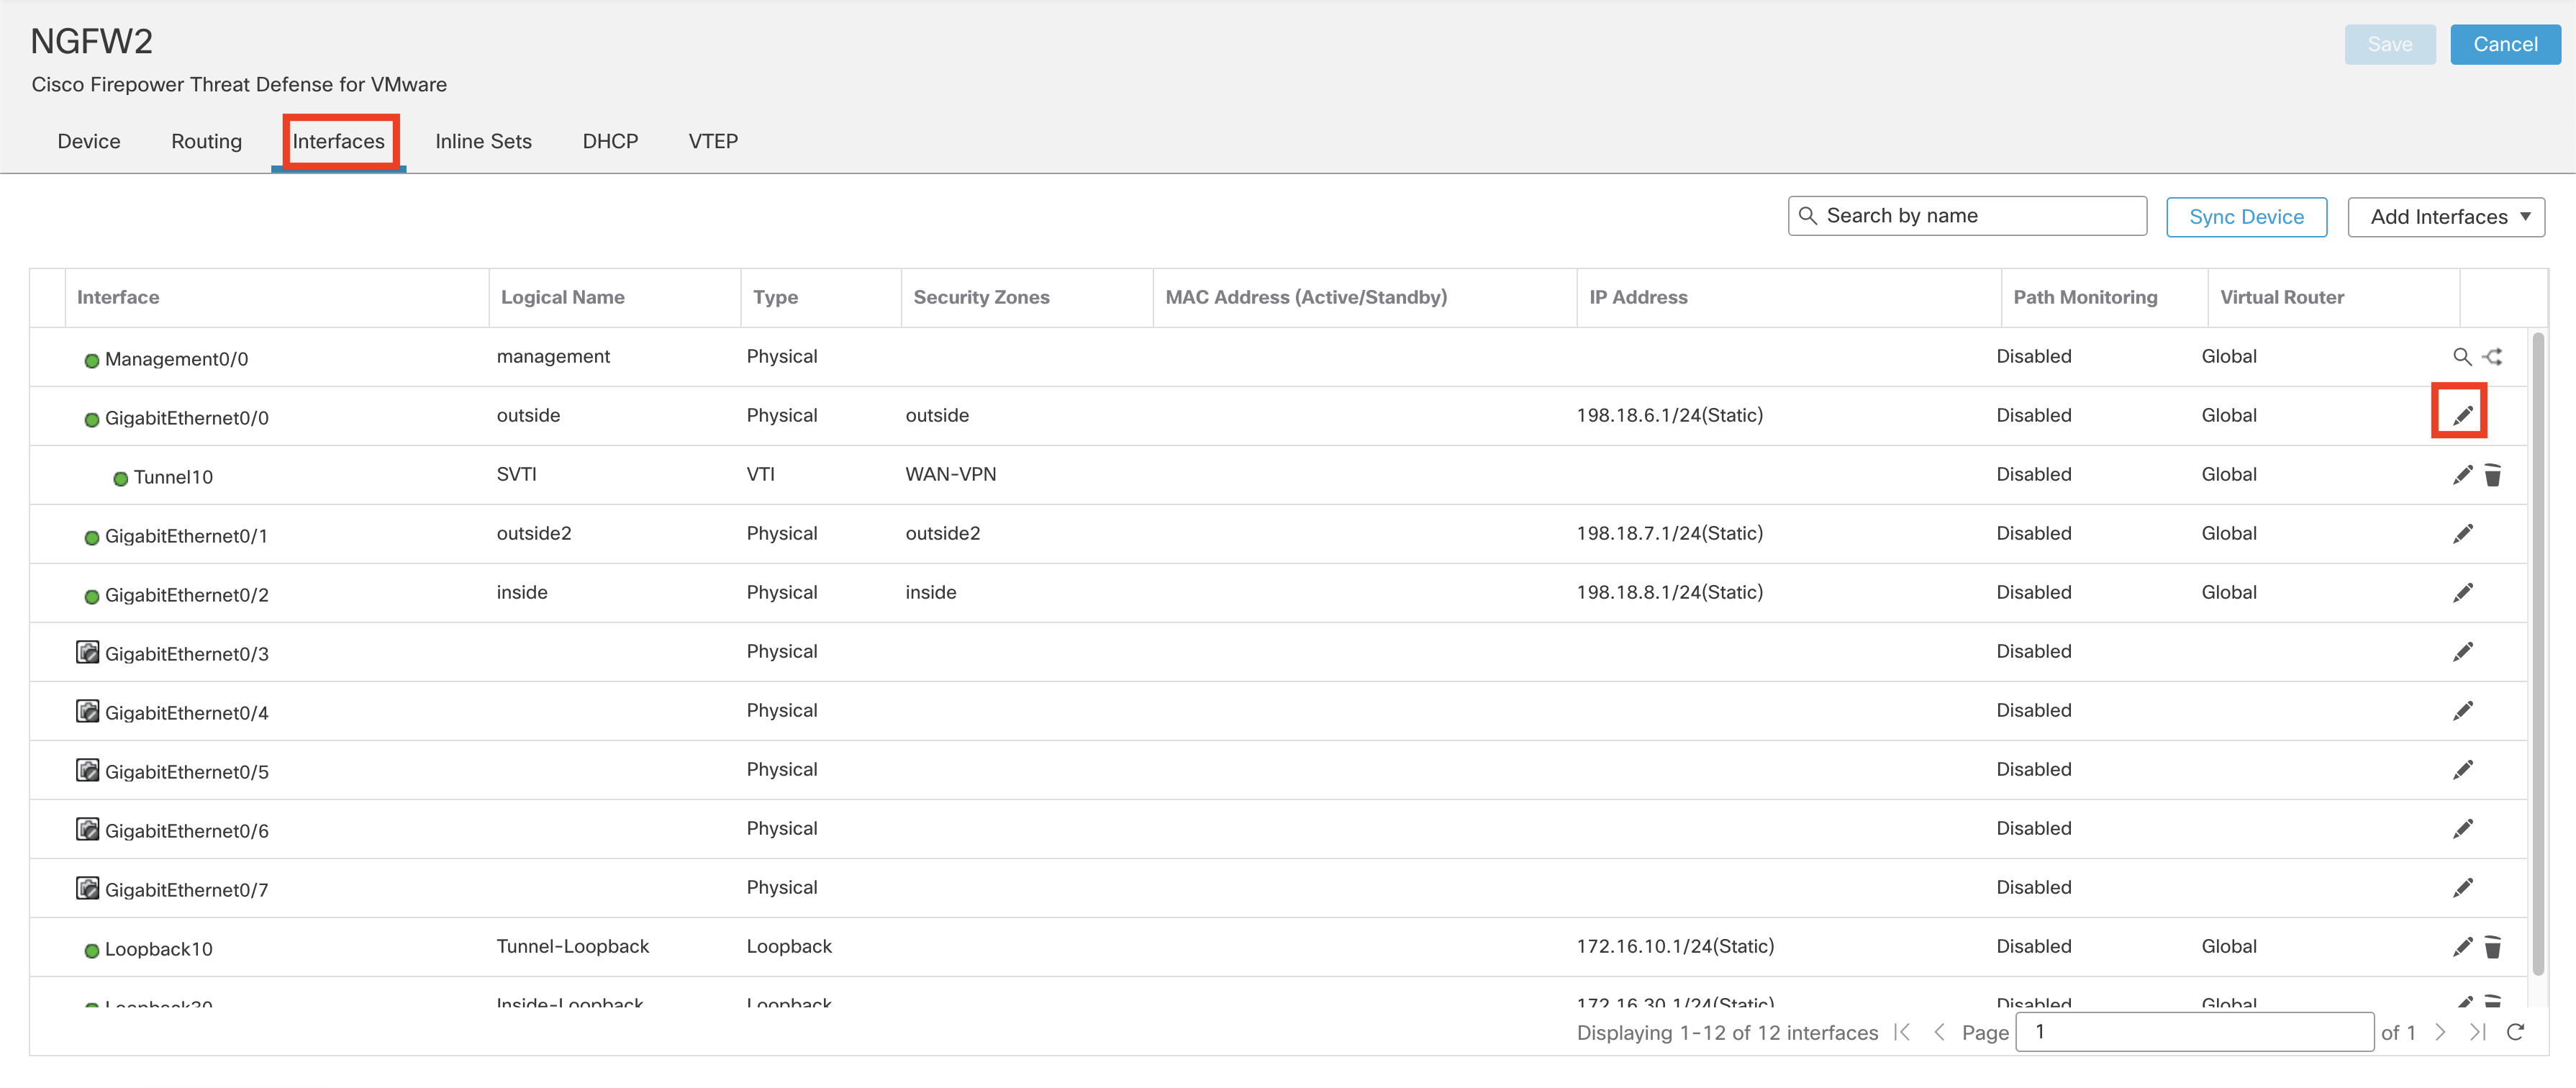
- Once the Edit Physical Interface window pops up, click on Path Monitoring tab
- Click the Enable IP based Path Monitoring check box
- Under Monitoring Type, keep the setting Next-hop of default route out of interface (Auto) unchanged
- Ensure the Enable HTTP based Application Monitoring is checked
- Click Ok to save the changes
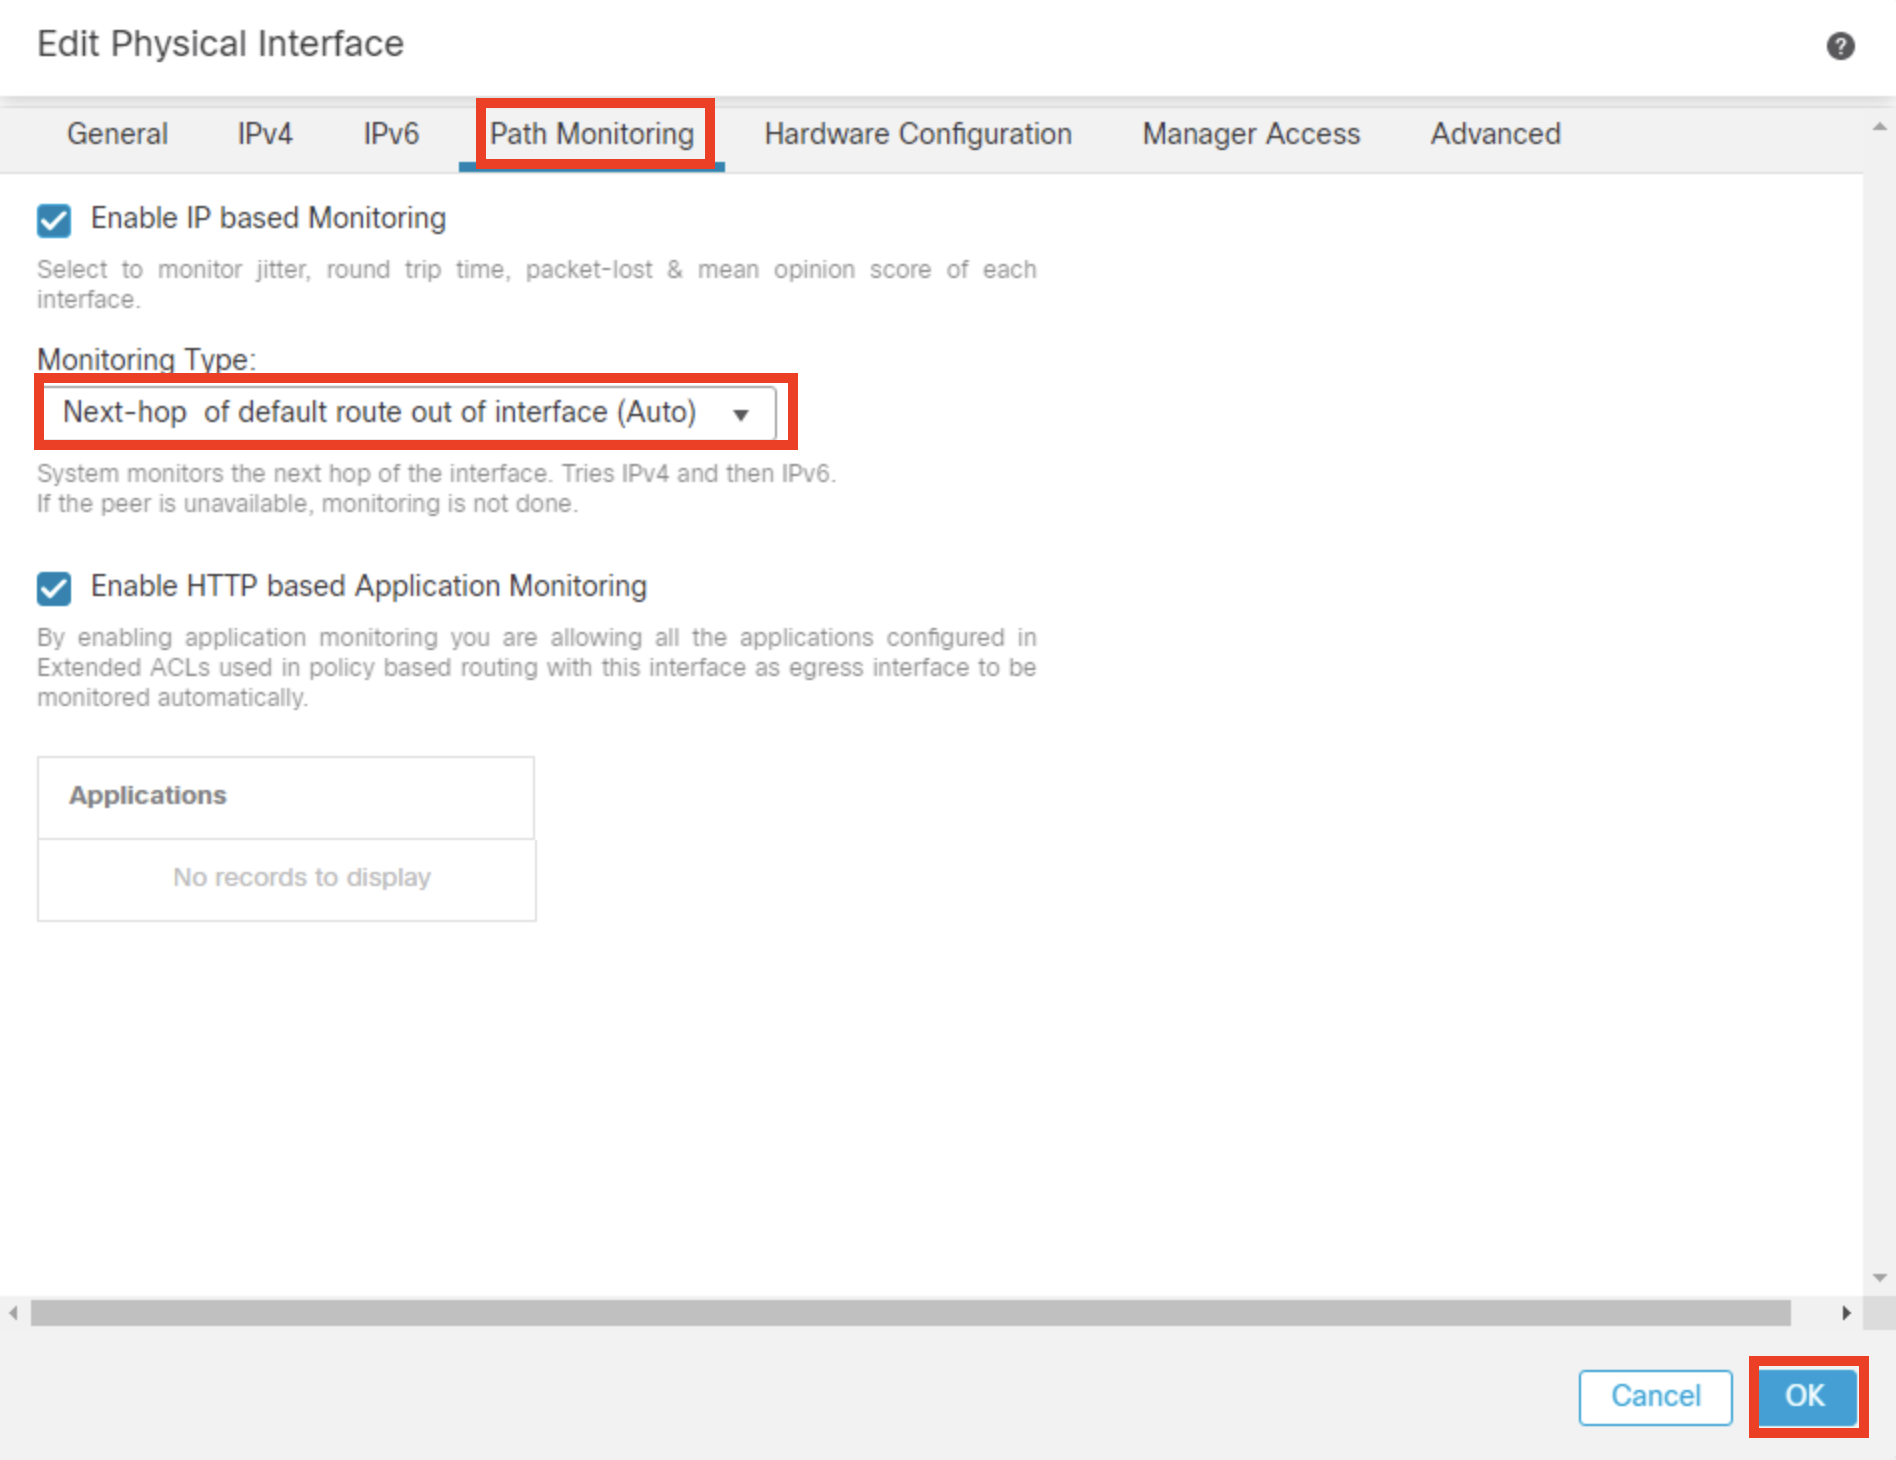
- Confirm the Path Monitoring is enabled for outside interface.
- Repeat Steps 3-8 for the outside2 interface
- Once done, ensure that Path Monitoring is enabled for all the egress interfaces i.e. outside, outside2

- Click Save to write the configuration changes
Step 2: Configure PBR for Atlassian and Splunk Application Traffic
- Click on Routing tab
- Click Policy Based Routing
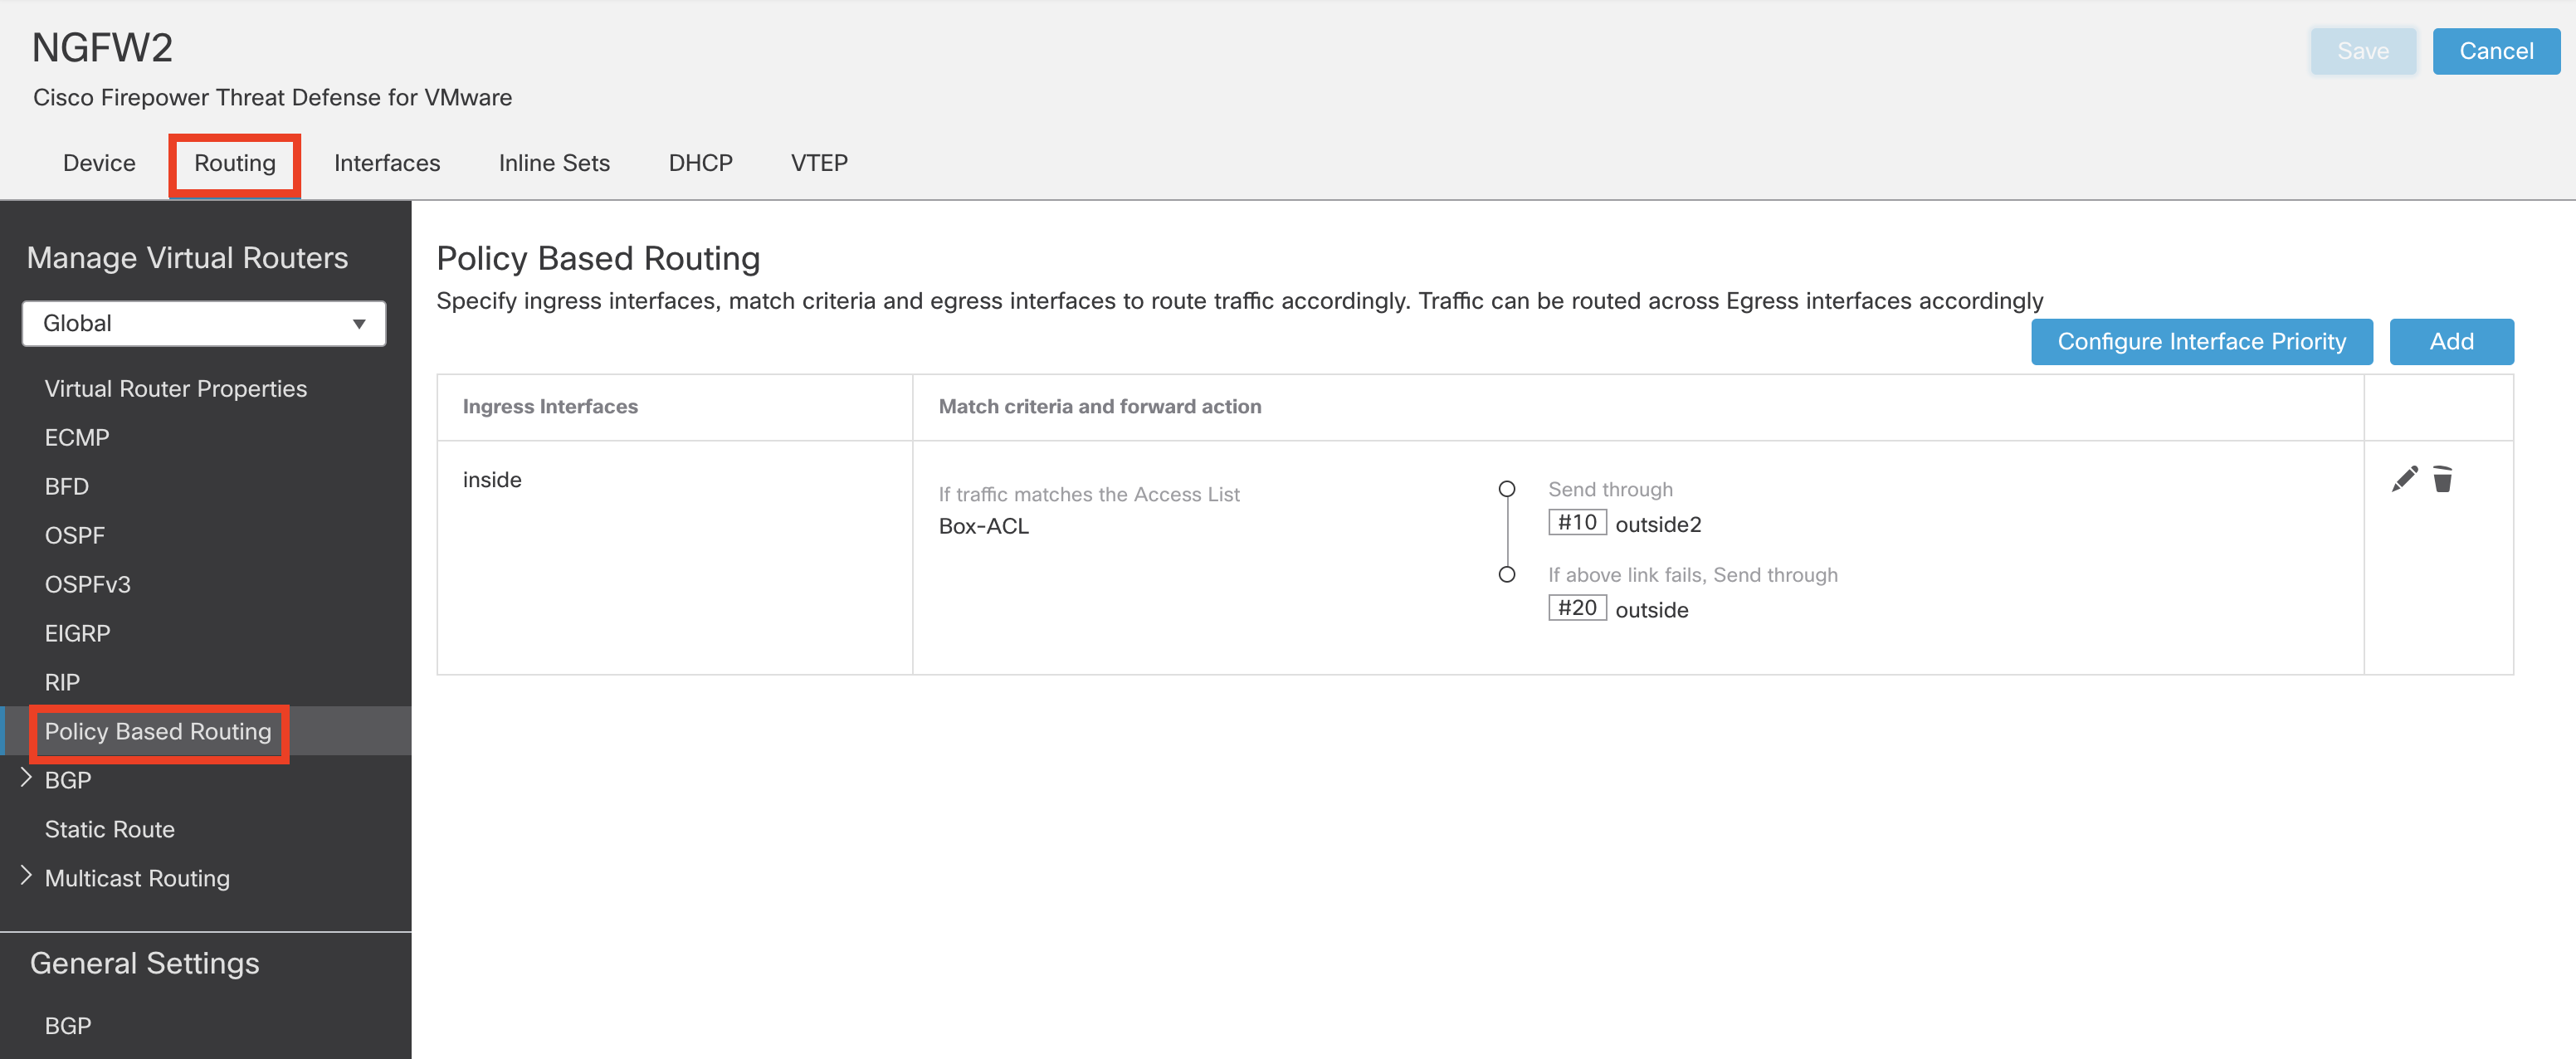
- Click on Pencil icon to edit Policy Based Routing rules.

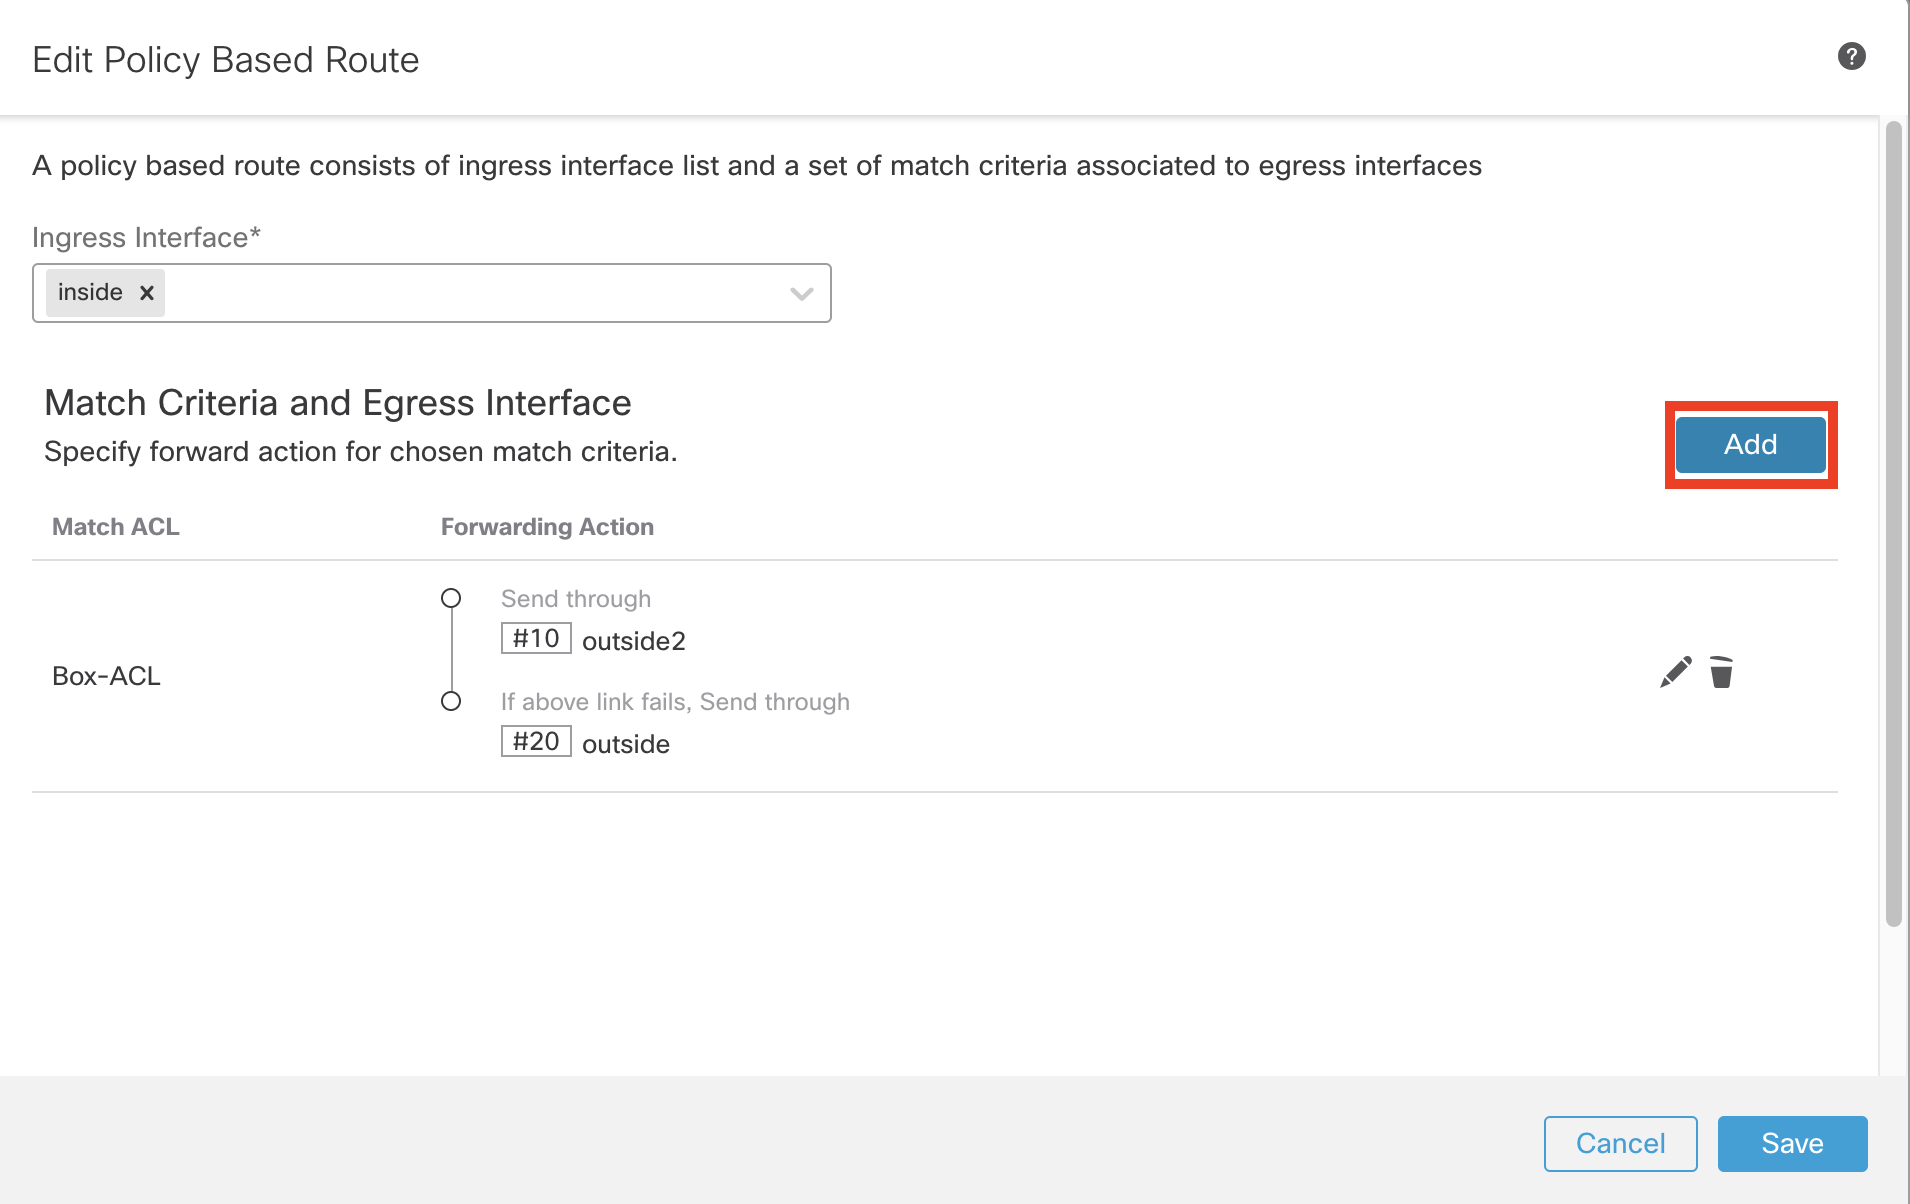
- Click Add to configure Match Criteria and Egress Interface (Forwarding action) for Atlassian application.
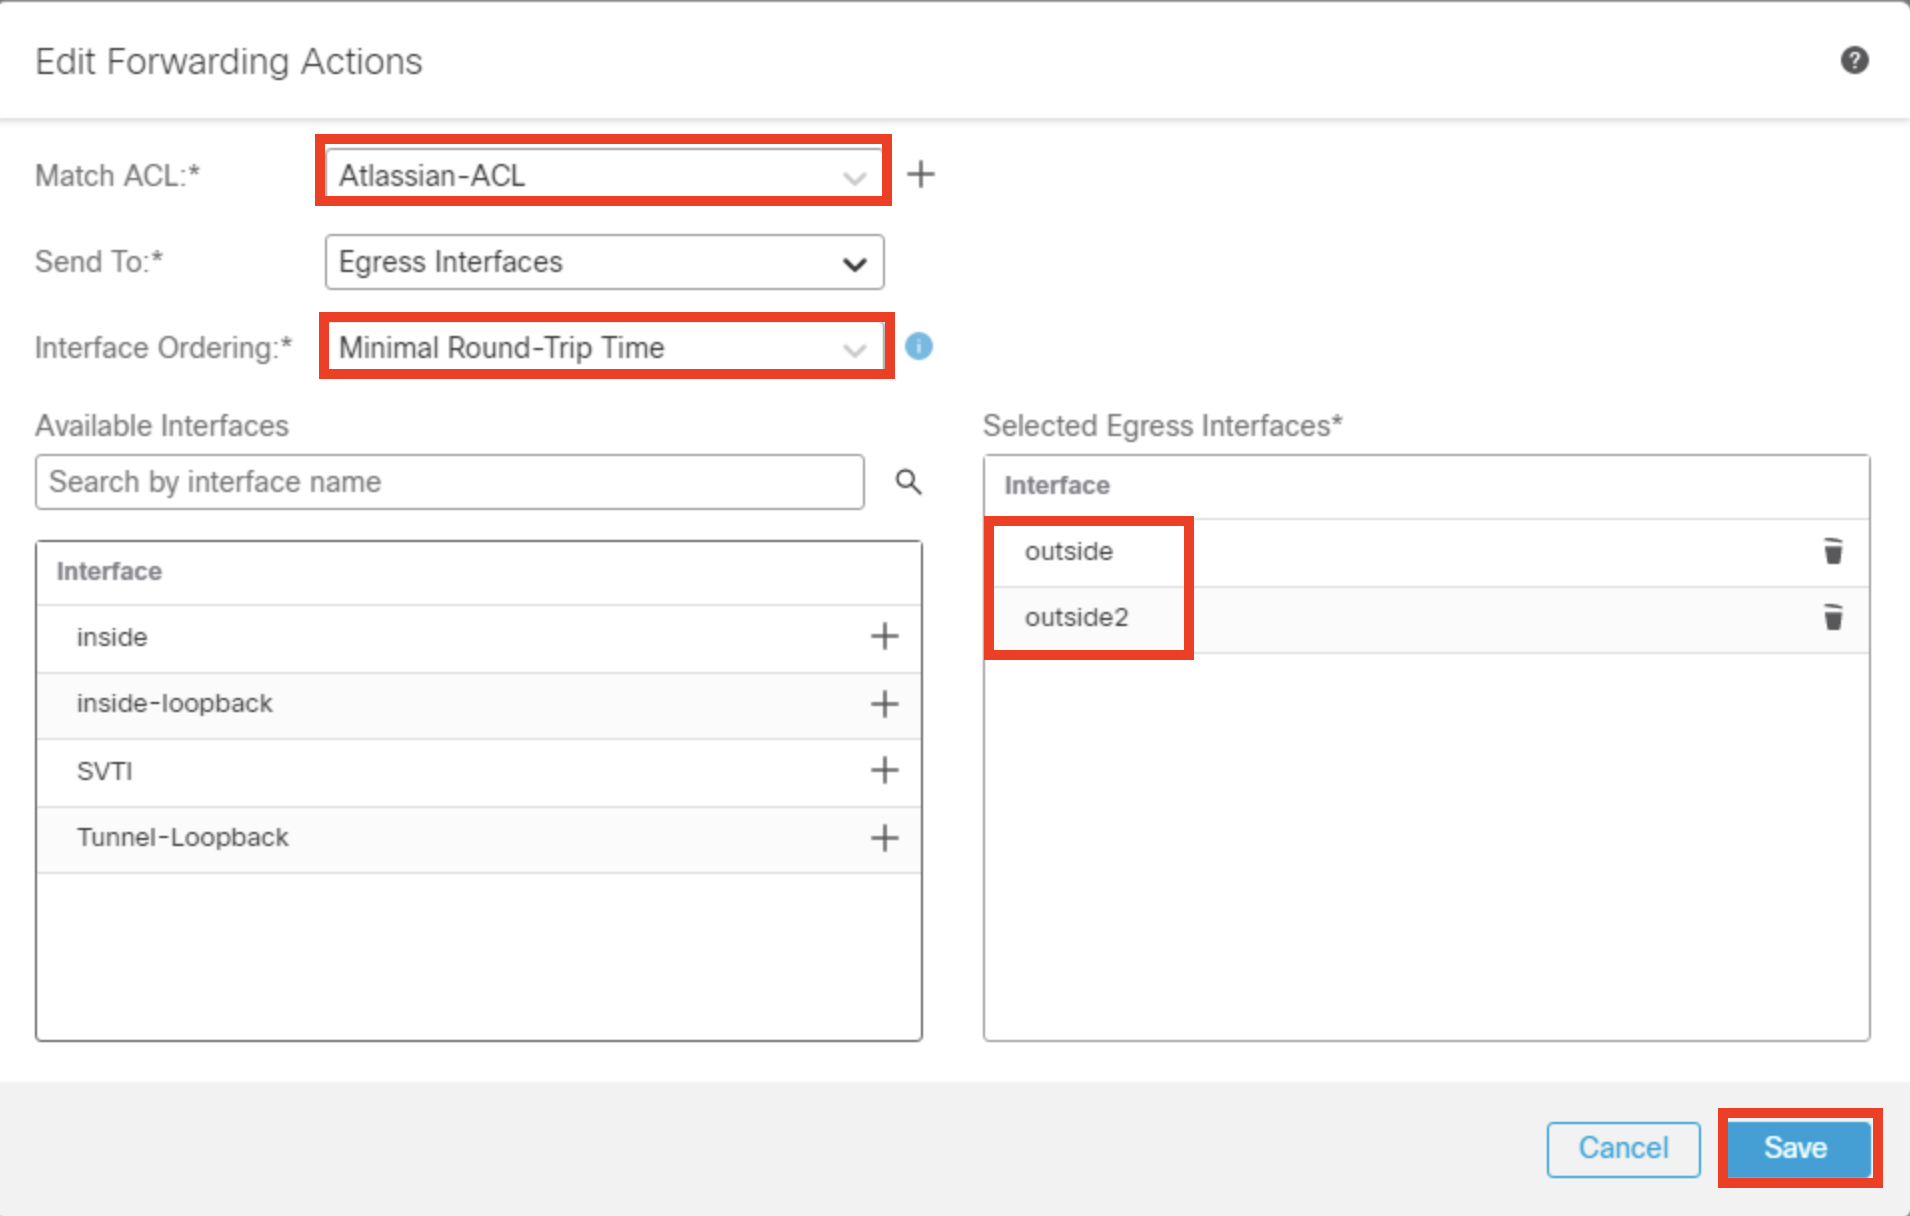
- From the Match ACL dropdown menu, select Atlassian-ACL
- Ensure the setting for Send To field is set as Egress Interfaces
- Choose Minimal-Round-Trip Time for Interface Ordering
- From Available Interfaces, click + icon next to outside and outside2 interface to move them to Selected Egress Interfaces.
- Click Save
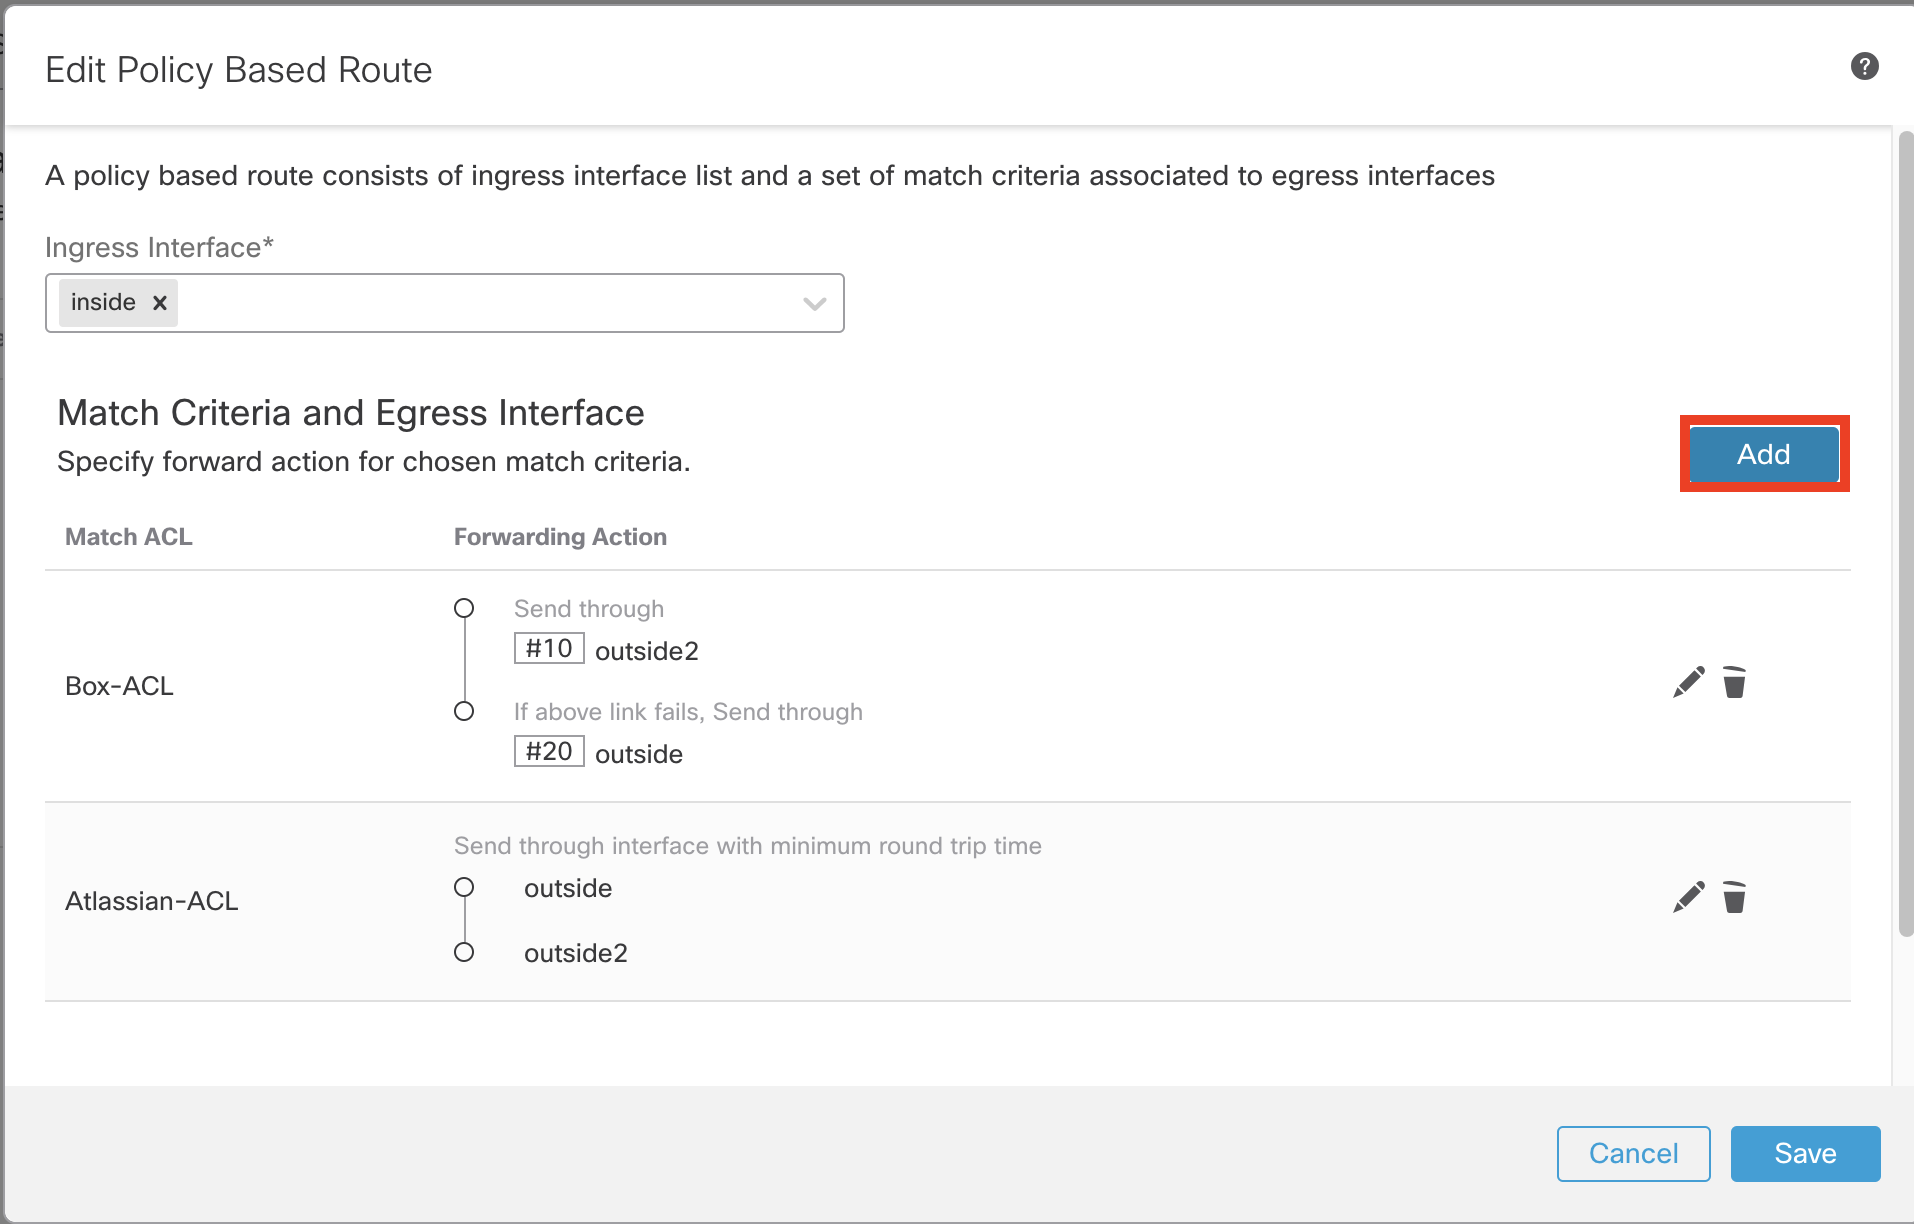
- Click Add again to configure Match Criteria and Egress Interface (Forwarding action) for Splunk.
- From the Match ACL dropdown menu, select Splunk-ACL
- Ensure the setting for Send To field is set as Egress Interfaces
- Choose Minimal Jitter for Interface Ordering
- From Available Interfaces, click + icon adjacent to outside and outside2 interface to move them to Selected Egress Interfaces.
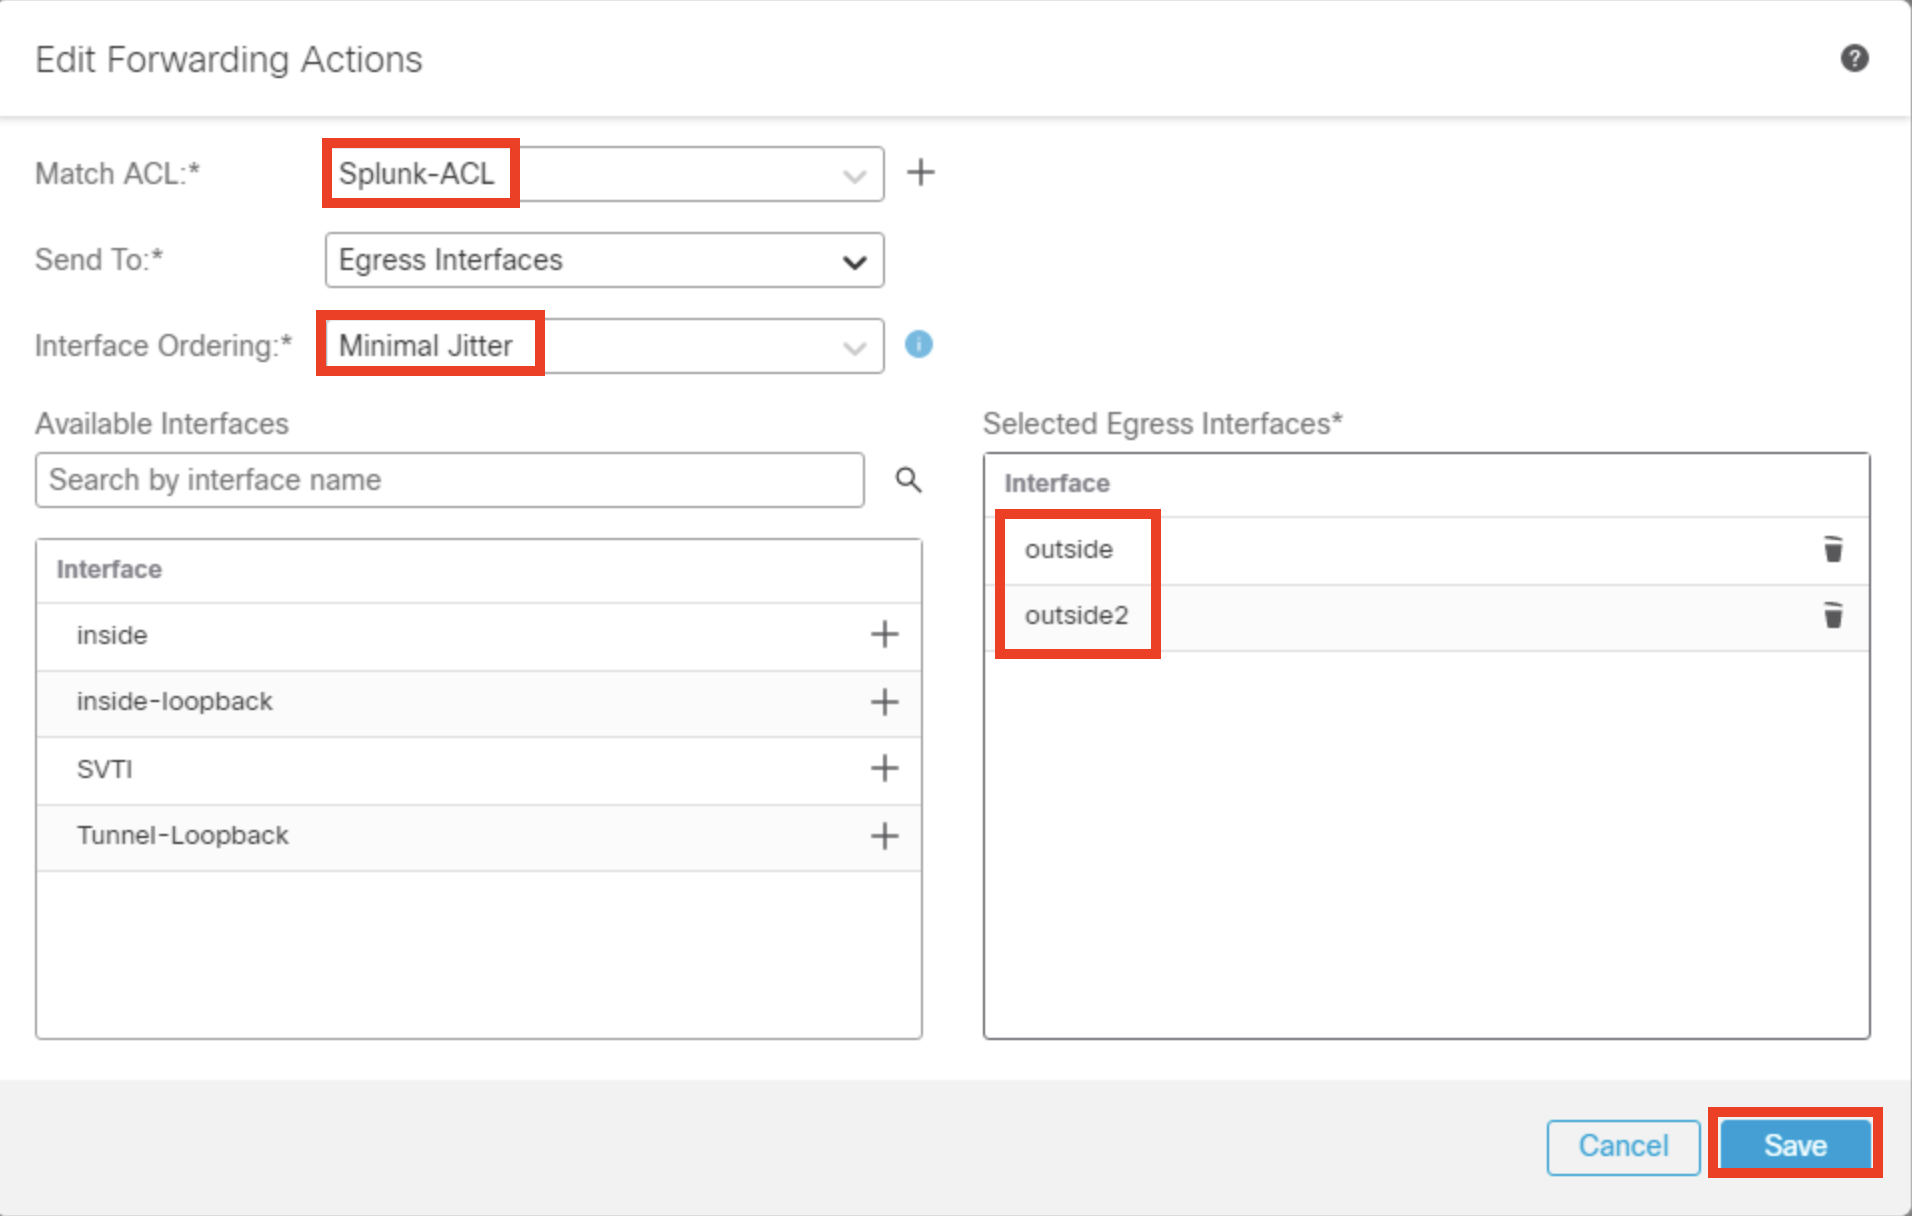
- Click Save
- Complete policy based routing rule looks as shown below.
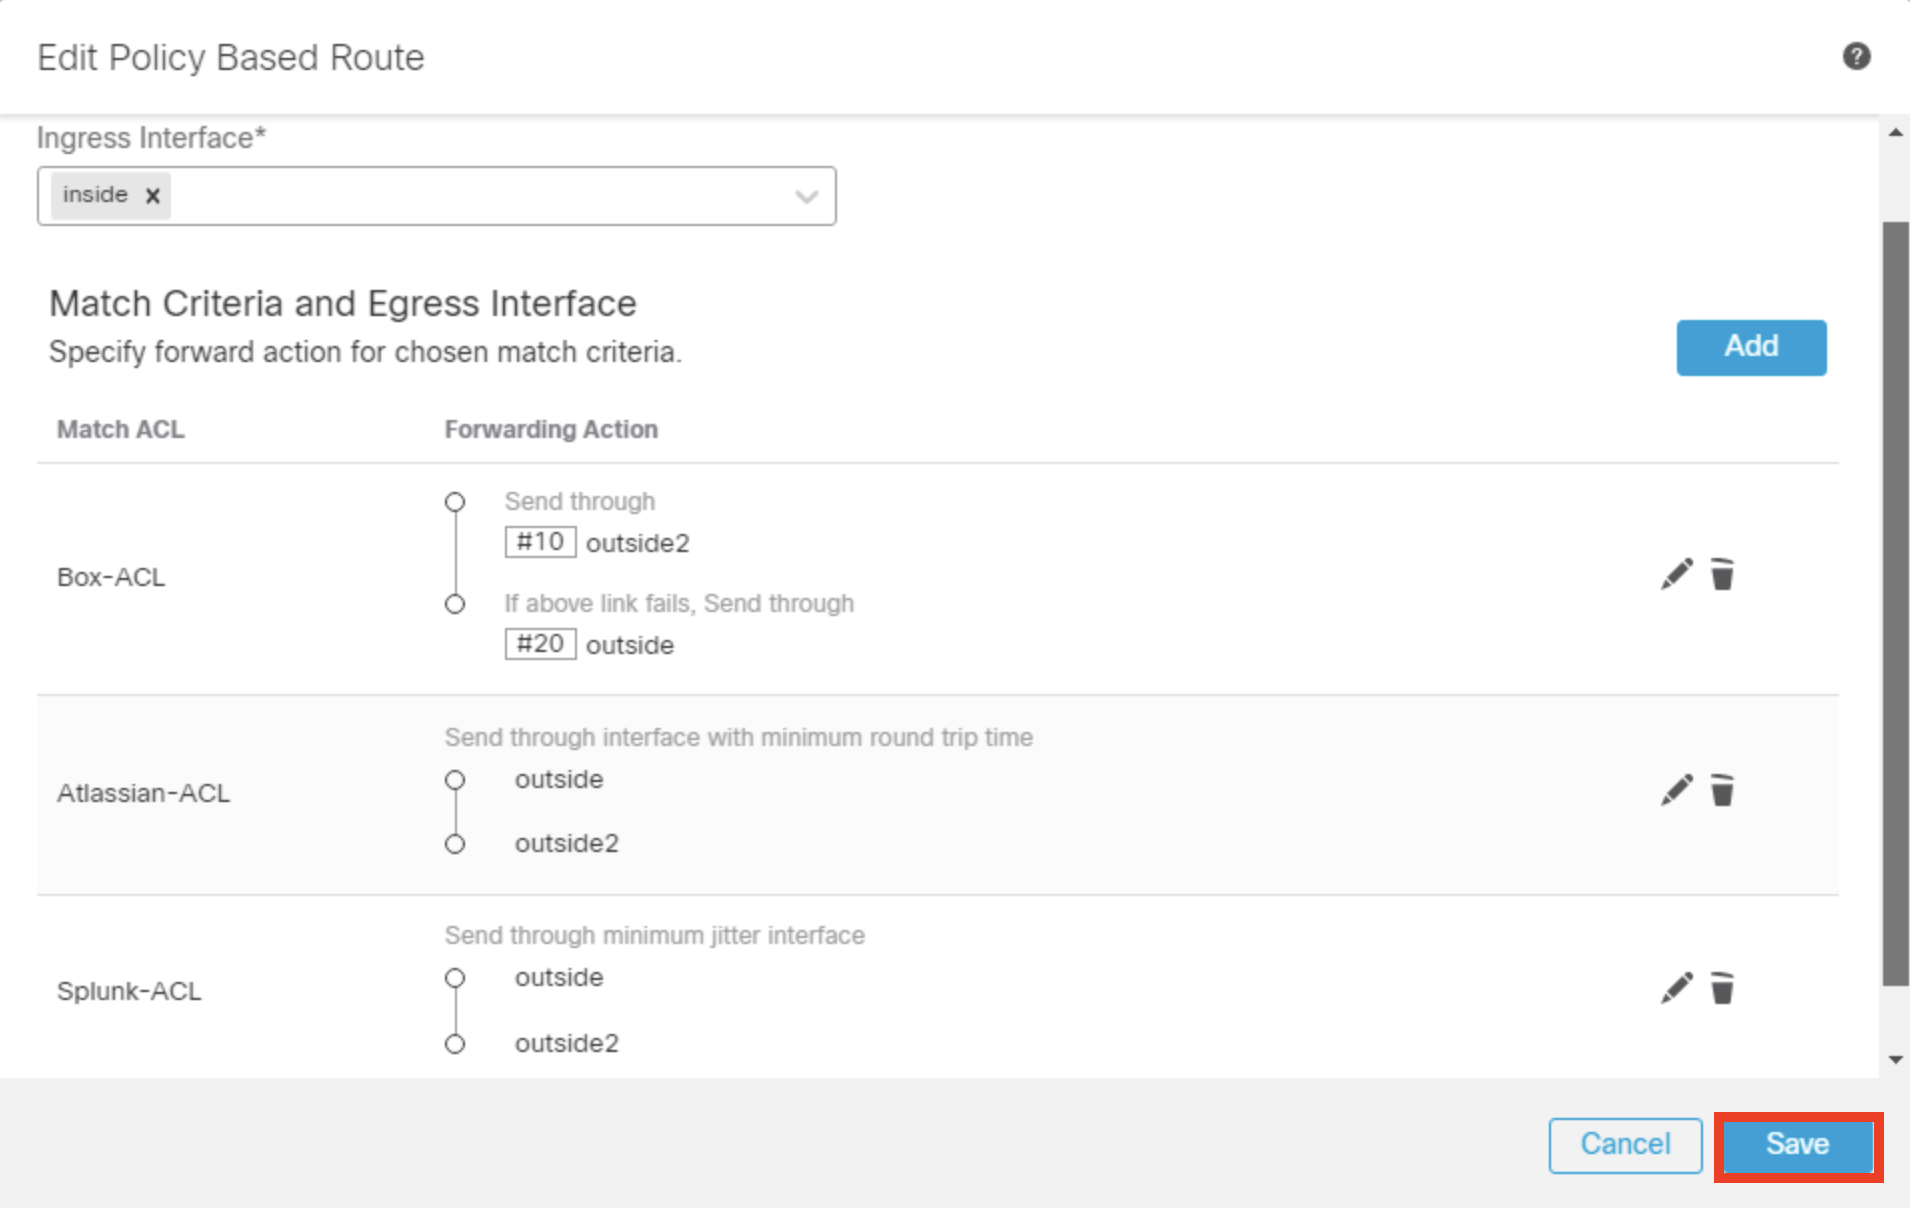
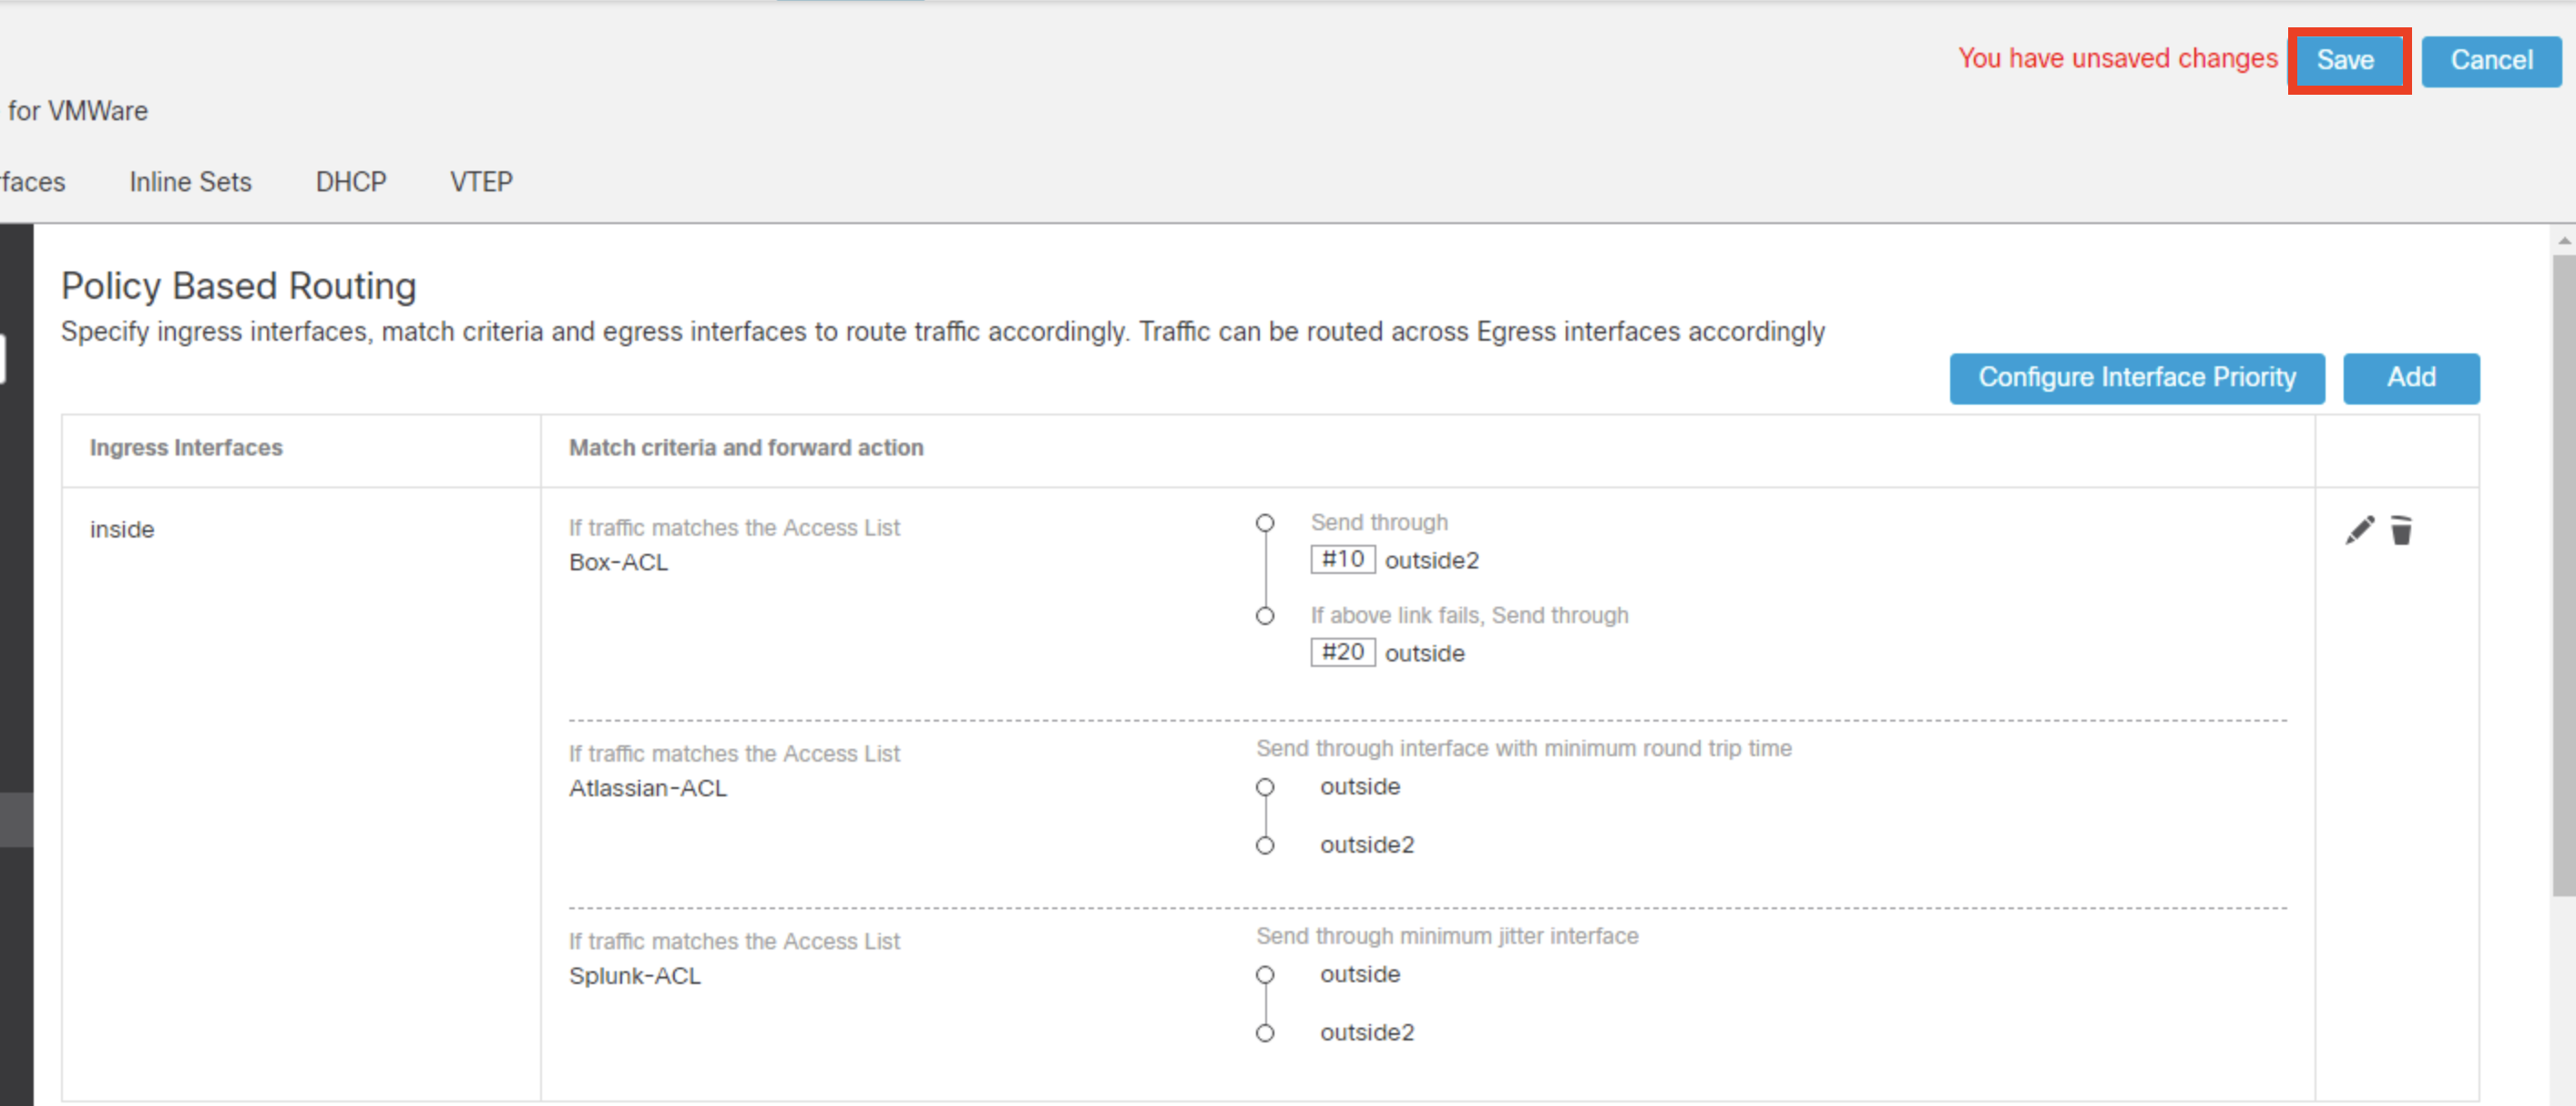
- Click Save .
- Click Save on the top right to save the changes.
Step 3: Deployment
- Click on Deploy > Deploy All to apply the configuration to NGFW2.
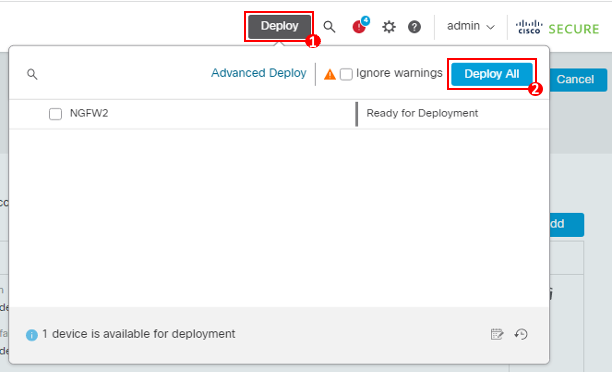
Note
If you see any warnings during deployment, check the Ignore warnings checkbox and click Deploy again.
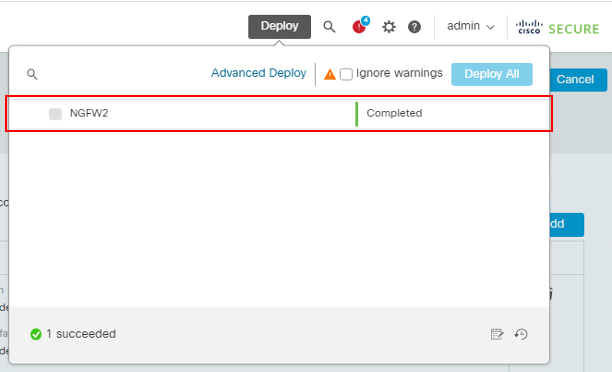
- Ensure that deployment is successfully completed
Task 7: Verification of Applications Traffic Flow
In this task, we will initiate traffic for all the applications(Box, Atlassian, Splunk) from wkst2 behind NGFW2 and ensure the applications traffic flow follows the policy based routing rules configured in the above tasks
Note
Before proceeding with verification, please make sure to clear the browser cache to initiate new sessions from the workstation on which policy based routing rules will be applied by Secure Firewall.
Step 1: Verify Box application Traffic Flow
- On wkst2, launch Chrome and navigate to https://box.com and confirm the website is accessible
- Navigate to Analysis > Unified Events
- Within the Web Application filter, enter the name Box and click Apply

- Observe the Egress interface for Box traffic, it will go through outside2 interface because of the PBR configuration that we did.
Note:
- Set the Sliding Time Range to 30 minutes to see the logs from last 30 mins.
- Outside2 interface has a lower priority. The lower the priority, the better.
- If there is any deviation in the result, make sure to clear the browser cache and test the application traffic again.
Step 2: Verify Interface Priority Value
In this step, lets check which egress interface has lower Interface Priority. To do that
- Go to Devices > Device Management
- Click on the pencil icon of NGFW2.
- Click on the Device tab on top to see the complete information about the device.
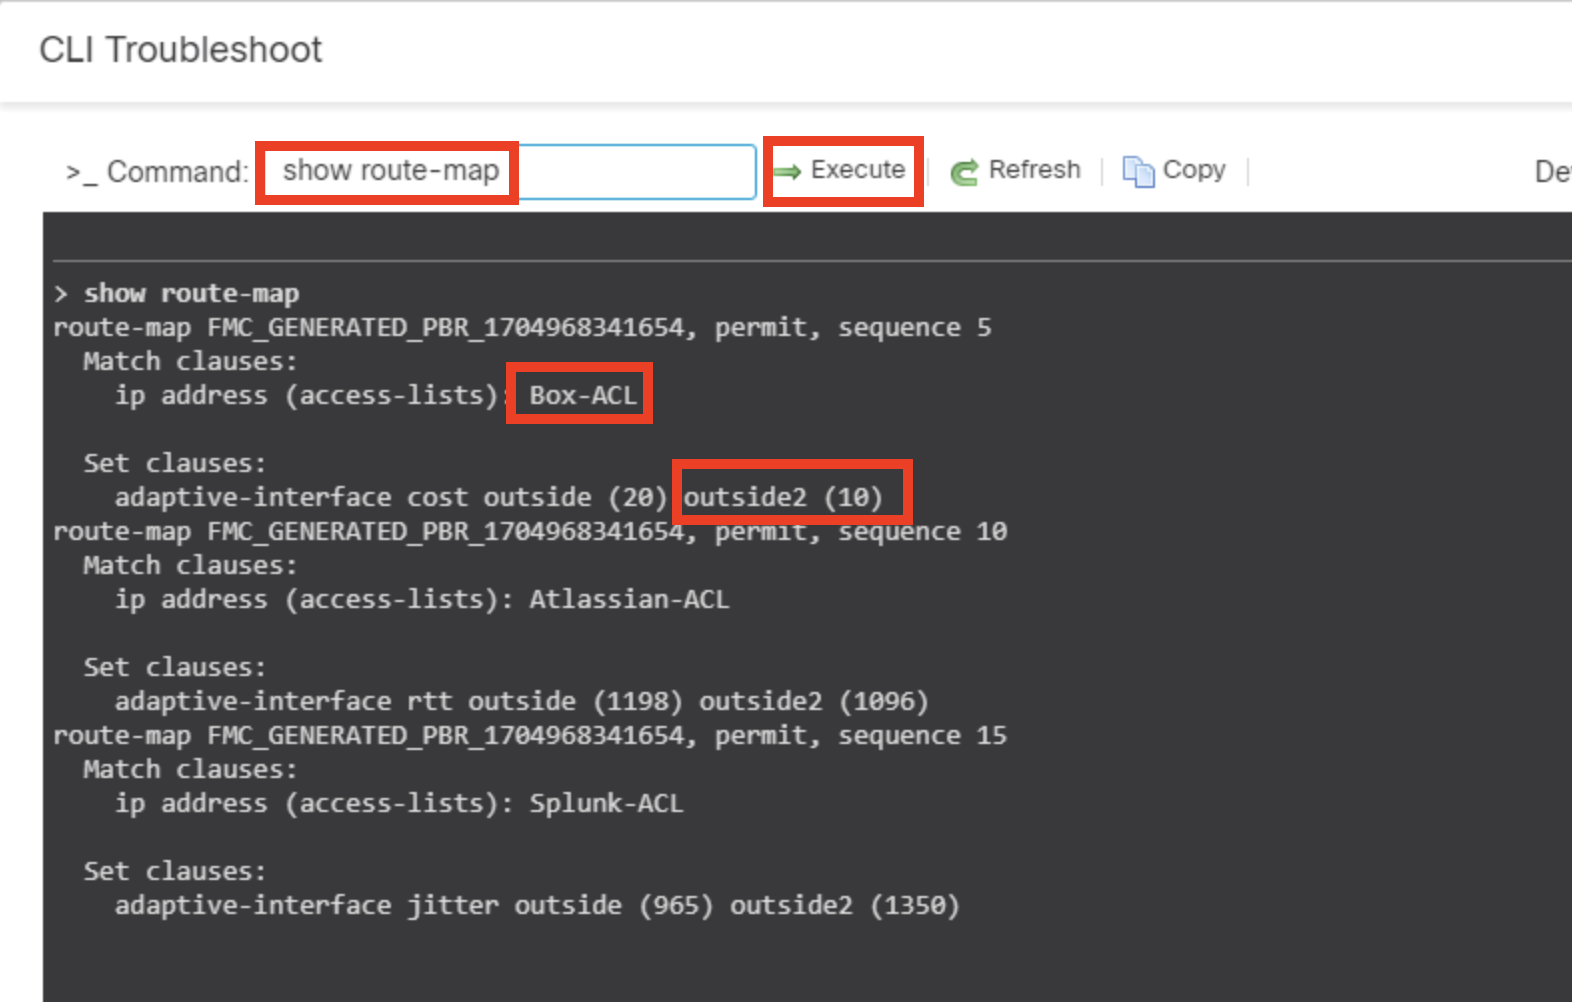
- In General > Troubleshoot > CLI
- Type show route-map in the text box and click Execute and observe the values of Interface Priority and make sure the Box application traffic should choose the egress interface with less priority egress interface.
Step 3 : Verify Atlassian application Traffic Flow
- On wkst2, launch Chrome and navigate to https://atlassian.com and confirm the website is accessible
- Navigate to Analysis > Unified Events
- Within the Web Application filter, enter the name Atlassian and click Apply

- Observe the Egress interface for Atlassian traffic, it will go through the egress interface with minimim round-trip time because of the PBR configuration that we did
Note:
The traffic may go through the outside interface in your pod depending upon the current RTT values for each ISP.
Step 4: Verify minimum round-trip time value
In this step, lets check which egress interface has minimum round-trip time.To do that
- Navigate to Devices > Device Management
- Click on NGFW2.
- Click on the Device tab on top to see the complete information about the device.
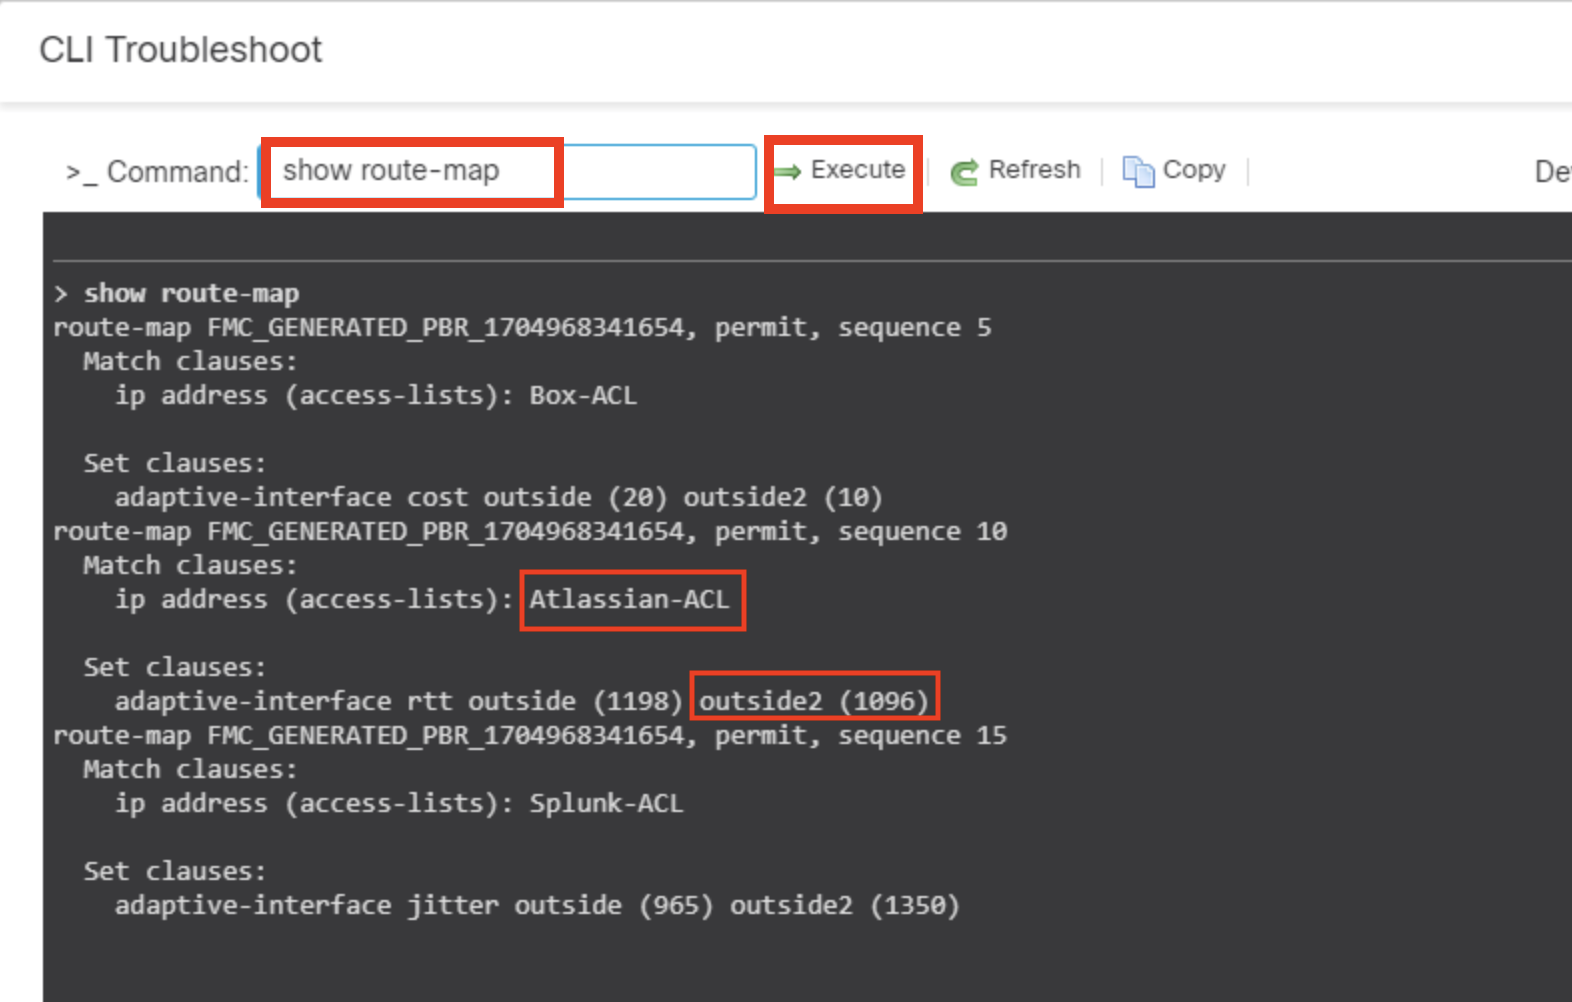
- In General > Troubleshoot > CLI
- Type show route-map in text box as shown below and click Execute
- Observe the values of round-trip time and make sure the Atlassian application traffic should choose the egress interface with minimum round-trip time.
Note:
The RTT values of your pod may show a different values for interfaces based on ISP's. This is an example, actual results may vary based on individual pods.
Step 5: Verify Splunk application Traffic Flow
- On wkst2, launch Chrome and navigate to https://www.splunk.com and confirm the website is accessible
- On FMC, Navigate to Analysis > Unified Events
- Within the Web Application filter, enter the name Splunk and click Apply

- Observe the Egress interface for Splunk application traffic, it will go through the egress interface with minimum jitter value because of the PBR configuration that we did.
Note:
The traffic may go through the outside2 interface in your pod depending upon the current Jitter values for each ISP.
Step 6: Verify minimum jitter value
In this step, lets check which egress interface has minimum jitter value.To do that
- Navigate to Devices > Device Management
- Click on NGFW2
- Click on the Device tab on top to see the complete information about the device.
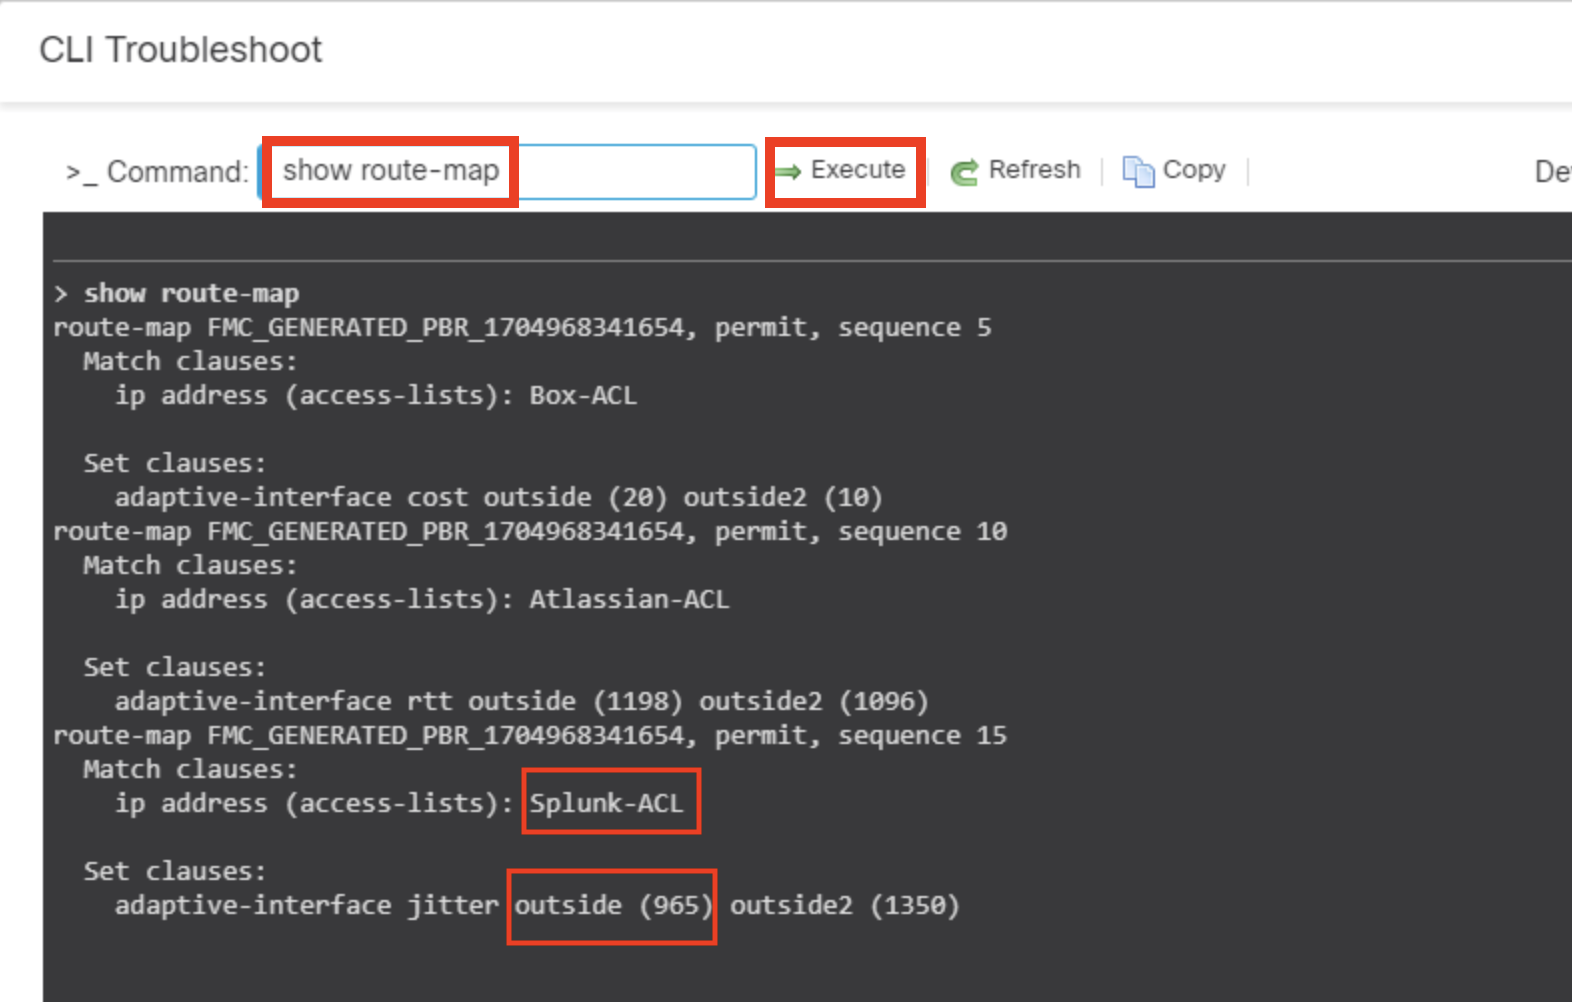
- In General > Troubleshoot > CLI
- Type show route-map in text box and click Execute and observe the values of jitter and make sure the Splunk application traffic should choose the egress interface with minimum jitter value.
Note:
The jitter values of your pod may show a different values for interfaces based on ISP's.This is an example, actual results may vary based on individual pods.
Conclusion
This concludes the Policy Based Routing lab on Cisco Secure Firewall.
Updated almost 2 years ago
