
Logging Best Practices
Introduction
This guide covers event types, logging settings, and best practices for the Cisco Secure Firewall platform. This includes considerations for configuring the logging settings for different policies, the configuration of local log storage databases, and setting both local logging for the Firewall Management Center (FMC) and remote logging for Splunk or other SIEMs. Because exporting logs to a SIEM can use significant data ingest resources, guidelines are also provided for calculating events per second (EPS) and assessing the corresponding data ingest.
This guide breaks firewall logs into three categories:
- Threat Events – logs for security related events such as attacks and malware
- Traffic Events – logs for general network traffic
- System Events – logs generated by the firewall platform itself, such as audit and health events
For deployments that are utilizing Cisco’s offering of 5GB per day of Splunk data ingest for each firewall, the recommendation is to focus on importing threat events first, as these offer the highest value and are relatively low volume compared with traffic events. For most deployments, ingesting traffic events will greatly exceed 5GB per day, depending on deployed firewall model and throughput. While there are many use cases that benefit from exporting traffic events to a SIEM, the corresponding data ingest requires a significant amount of resources.
The purpose of this guide is to inform and facilitate decisions on how to configure and prioritize local and remote logging settings. Step by step configuration guidance for remote logging configuration is provided in the External Logging Configuration guide.
Guidance for Remote Logging Configuration
Syslog vs. eStreamer
Event logs can be sent to remote storage via either syslog or eStreamer. eStreamer is a Cisco proprietary protocol that offers ease of configuration, dashboard, log enrichment (packet data for intrusion events) and Splunk advanced detection benefits. Syslog is recommended for any new deployments as it has the best performance scaling and is road mapped as the preferred logging configuration.
For a full comparison of eStreamer vs. syslog, please see the Comparison of Syslog and eStreamer for Security Eventing section in the administration guide. Please note that feature enhancements for syslog are currently planned for upcoming releases.
Event Types Available within Firewall Management Center
This guide breaks firewall events into multiple types:
- Threat Events
- Traffic Events
- System Events
Each type of event is explained in the following sections. Of all the log types, threat events should be prioritized as they are the only log type for suspected malicious activity. Threat events offer the most value for analysis and correlation, while the other event types facilitate other use cases. While connection events (within the traffic category) have a broad range of uses, their volume means that a careful assessment must be taken before ingesting them at scale.
Threat Events
Threat events include Intrusion, file and malware, and security intelligence events, and deal primarily with connections that may be threats. Threat events should be the top priority for external log ingestion. Threat events are also typically the least frequent, and so affect data ingestion limits the least. Security intelligence events can produce relatively high volume, but can also be tuned to reduce or remove noisy categories that are not organization priorities.
Intrusion Events
Intrusion events are generated when a single (reassembled) packet matches a Snort rule. These events include both details on the connection (the typical 5 tuples of source IP, destination IP, source port, destination port, and protocol) along with some traffic fields also available in connection events, and other log data related to the detection. The full matching packet is also captured in intrusion events, which can be critical for analysis. The full packet details can be sent to Splunk via eStreamer, and is roadmapped for syslog in future releases.
File & Malware Events
Malware events contain typical connection details like IPs and ports, and also multiple fields specifically related to files and malware like file name, file hash, and threat score, among others. Malware events have high fidelity for threat analysis.
File events are generated when a file is detected within network traffic that passes through the firewall. These are separate from malware events, which occur when a malicious file is detected in network traffic. File events offer insights into the volume of files that are being transmitted unencrypted in the network (for deployments that aren’t utilizing decryption), and the hosts and protocols associated with the file transmissions.
eStreamer allows users to choose between sending both file and malware logs together, while the configuration for syslog is for both log types or neither.
Security Intelligence Events
Security intelligence events are generated when a connection involves a malicious IP, URL, or DNS request. Security intelligence events offer a way to sift through the much larger set of connection events and focus on the ones that have a malicious indicator. Note that security intelligence can generate a large volume of events, and also has granular tuning options.
Traffic Events
Traffic events log details of traffic that passes through the firewall, regardless of whether the traffic is malicious or normal business operation. These logs can assist with troubleshooting, provide insights into network activity and business operations, deliver raw data for anomaly detection, and yield valuable supporting information in a broader investigation.
The most useful traffic events are connection events, though these tend to be very high volume and have large data ingest costs. The other traffic event types are more limited use or situational.
Connection Events
Connection events are generated any time a connection matches an access control rule (or default action) that has logging enabled. It’s common for most or all access control rules to have logging enabled, which makes connection events an aggregate summary of the traffic that passes through a given firewall or firewall deployment. This can have tremendous value when looking for unexpected or unusual traffic, or broad traffic trends. Connection events can also be vital for investigating breaches or other compromises after the fact, as they offer a history of network traffic for a well designed and well segmented network. However, capturing and storing connection events requires a large commitment of data ingest and storage resources.
Prefilter Events
The prefilter policy allows users to block or fastpath traffic using system logic that is less resource intensive than the access control policy. Many admins use the default prefilter policy, which directs all traffic to the access control policy. For admins who modify the prefilter policy, logging is available for prefilter rules that have the block or fastpath action. If block or fastpath rules are in use in a prefilter policy, consider whether logging should be enabled to generate logs for these connections that match the prefilter policy but not the access control policy, or whether log records of traffic blocked or fastpathed by the prefilter policy is unneeded. Some deployments may opt not to log fastpathed or trusted traffic as it is already known and trusted, while other deployments may prefer to record logs for all traffic.
Decryption Events
Decryption events are generated when traffic is decrypted using the decryption policy. This event set will not exist for admins who are not performing TLS decryption. Decryption logs provide details into the traffic that is being decrypted, and can be useful for some types of troubleshooting and for gaining insight into encryption standards in use on the network (though some of these details can also be gleaned from connection events).
System Events
System events are internal events generated by each firewall and by the FMC. System events can contain health and troubleshooting data, and audit records of actions taken by admins and other users.
Audit Events
Audit events record user actions taken on the FMC. They can be useful for verifying that administrative actions take place during approved change windows, verifying what user made a specific change, and for verifying that user and user access are within expected parameters.
Audit events can range from infrequent to frequent depending on the number of FMC users and their activity levels. Organizations may opt to export audit events to external log storage to ensure an audit record is preserved in the event that the FMC becomes inaccessible.
Health Events
Health events track system performance metrics like RAM and CPU utilization, disk usage, process status, interface status, and other areas of system functionality. These events are useful for identifying problems with the FMC and individual firewalls, and for verifying remediation.
Primary SOC & NOC Workflows for Firewall Events
Primary SOC Workflows
The most common SOC workflow is monitoring the threat events of intrusion, malware, and security intelligence. This includes performing true/false positive analysis and determining whether an attack was successful or not. These workflows can be performed directly on the events from the firewall, or as part of broader monitoring of aggregated logs in an XDR or SIEM platform.
SOC workflows are also commonly created for connection event monitoring. These workflows can include looking for rare or unusual connections within the event set, monitoring remote access protocols like RDP and SSH, and looking at broad traffic patterns to baseline the network and look for anomalies.
Monitoring of audit events can also be a SOC best practice, as this workflow can detect unauthorized access or unauthorized changes. A playbook built around audit log monitoring should include guidelines based on organization policy and change management.
Primary NOC Workflow
A NOC can leverage firewall connection events to verify network connectivity and confirm whether a connection was allowed or blocked (see the Beginning and End of Connection Logging section for considerations). The placement of firewalls at network boundaries and their logging capabilities make firewall logs an ideal resource for network troubleshooting and validation.
Guidance for Local vs. Remote Logging
Workflows
Events for any workflows that would benefit from remote logging should be prioritized. These include supplying threat events that can be used in advanced correlation and threat detection capabilities in SIEM and XDR platforms, workflows that benefit from aggregating all logs into a ‘single pane of glass’ for analyst efficiency, and workflows that have time or availability constraints that don’t align with local logging. An example of a time-based constraint would be investigating the source of a breach and needing to analyze the connection events for a compromised host days or weeks after the fact, a time frame where connection events could be pruned from local FMC log storage for some environments. An example of an availability-based constraint would be investigating the cause of failure for an FMC that has entered an inaccessible state and not having local audit logs available due to the failure of the FMC.
To facilitate the most workflows with the lowest data ingest costs, it is recommended to focus on threat events for remote logging and then assess other event types.
Storage
The FMC offers local event storage capacity that can last for days, weeks, months, or even years depending on the event type and traffic throughput for the firewall deployment. See the following Local Log Storage section for steps to confirm storage settings and assess log rates and retention. The primary exception to local log storage is connection events, which can last less than a day or even less than an hour for high throughput environments. The comprehensive network viewpoint offered by connection events makes them a high value log type for remote storage, but the high volume also means large data ingest costs.
Compliance
Federal regulatory frameworks and organization Security Policies can stipulate both remote logging requirements and minimum log retention periods. While an HA FMC configuration offers resiliency against log loss if one FMC fails, a correctly configured remote log storage system is considered the more resilient solution. Similarly the FMC may not meet minimum log retention requirements, particularly for connection events. It should also be noted that even though event types like intrusion events typically have extensive log retention periods on the FMC, the FMC database will always prune older events when the database limit is exceeded. This raises a small risk that an unexpected influx of events will prune older events and cause a violation of a mandated retention period.
Secure Firewall Management Center Local Log Storage
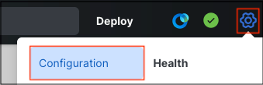
The FMC has native log storage that can last days, weeks, months, or longer depending on the volume of logs and the configured storage settings. Storage levels can be set in the FMC via Configuration > Database.
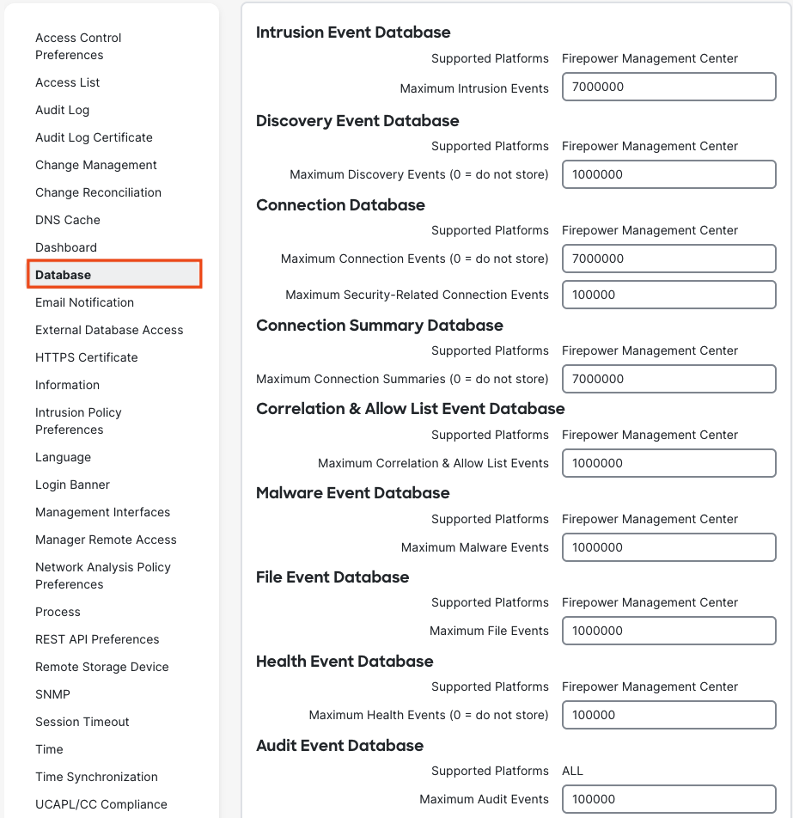
Each event type has its own database that determines how many logs can be stored. When the configured database limit is reached for an event type (e.g. intrusion events), the FMC will prune the oldest event in the set to avoid exceeding the database limit. For example, if a database has a configured limit of 5,000,000 events and a 5,000,001 event is received, the FMC will delete the oldest event in the 5,000,000 event database so that it can record the new event. While all event types can reach their database limits depending on event volume and log tuning, in most deployments connection events are the only event type that will persistently reach their database limit. This makes connection events both an attractive objective for external storage (because of the log volume) and a prohibitive objective for external storage (again, because of the log volume).
Database settings can be configured for each event type, and the FMC will display an error if a value that exceeds the maximum limit is selected. An example error for the connection database is shown:

Most event database settings can be left at the default. Deployments that are not exporting connection events to external logging storage may wish to increase the limit of the connection database to increase the number of logs that are retained before pruning. For an example, a firewall deployment that generates 10,000,000 connection events per hour could store 1 hour of events with the connection database set at 10,000,000, or 5 hours of events with the connection database set just below 50,000,000.
Considerations when Increasing Database Limits
Increasing the database limit for a given event type will increase the number of events stored, and can negatively impact query times. When adjusting event database settings, it is recommended to establish some baseline use cases for querying events, and either record search times or have stakeholders in place who can assess typical query times. After adjusting the database limit and allowing time for the database to reach its new capacity, run through the use cases again and determine whether an increase in query time (if one occurs) is acceptable, or not worth the tradeoff compared to having fewer events and a faster query time.
Estimating Event Rates for External Logging
Using the Logging Volume Estimator
Cisco provides a free logging estimator that can be used to generate a rough estimate of the log volume produced by an individual firewall or firewall deployment. Please note that the calculator should only be used to perform initial estimates, and more accurate calculations should be performed before enabling syslog. The logging estimator can be accessed at the following URL:
https://ngfwpe.cisco.com/ftd-logging-estimator
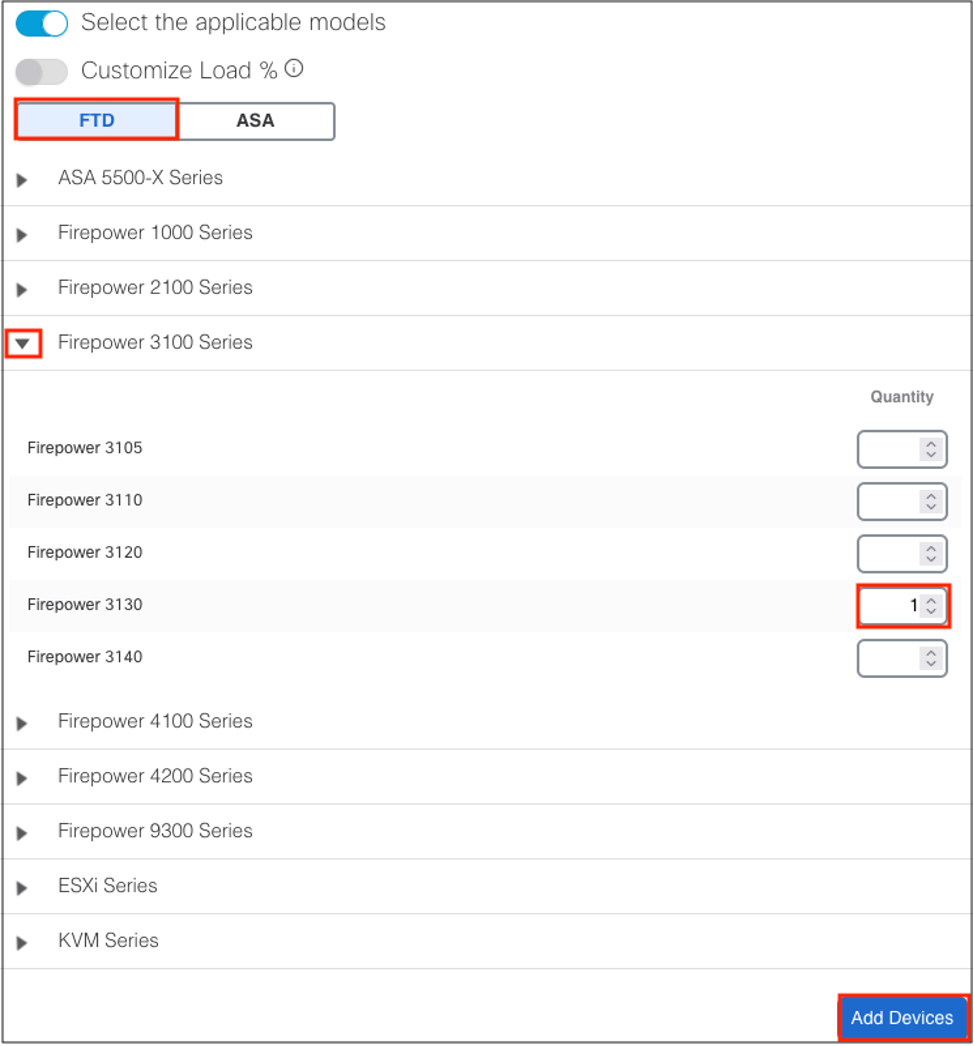
To use the calculator, simply specify the firewalls in the deployment and click Add Devices. An example is shown below for a single 3130.
Scroll down to see the results of the calculation.

The results show both an estimate of events per second (EPS) and the logging storage needed to store all of the events for a full day. Note that 2,106 EPS would be 181,958,400 events for a full day (2,106 x 60 seconds x 60 minutes x 24 hours = 181,958,400). This is a very large number, but it is also an estimate for all event types. Connection events make up the vast majority of all events, so exporting only threat events is much more manageable.
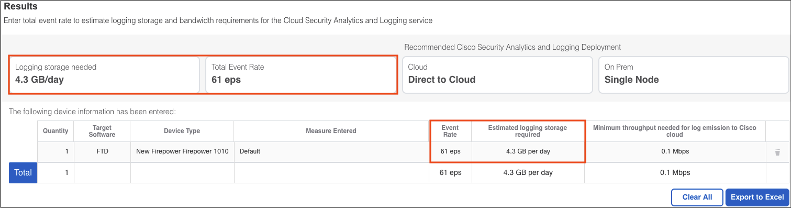
We can also run the calculation with a load estimate. Let’s run the calculation for a single 1010 that is utilized at 60%.
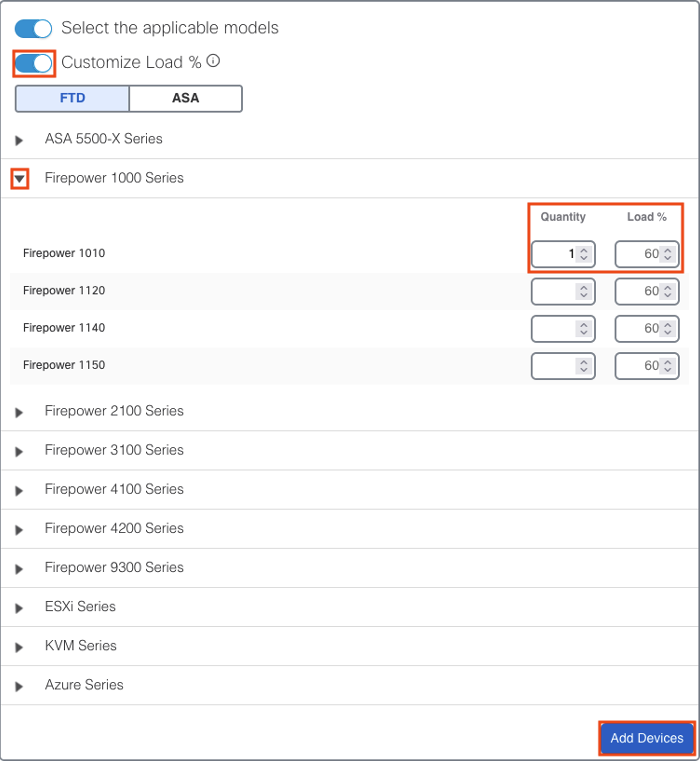
For the much smaller 1010 operating at 60% load, the rough estimate of event rate drops down to 61 EPS, and the required storage per day is estimated at 4.3 GB.
When adding multiple firewalls to a calculation, the calculator will display a total estimate for all firewalls and per model estimates (note the quantity on the left, which multiplies the EPS and ingest numbers in the same row).
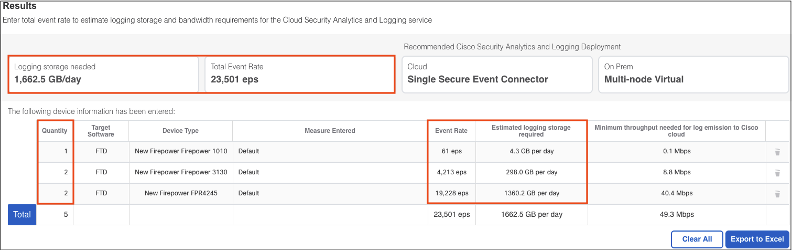
Not every firewall model is in the calculator, but remember that these are only rough estimates. If necessary, select a comparable model to create a benchmark. The next section covers calculating a more accurate EPS number for your environment.
Calculating Total Events per Second with Unified Events
We can count the precise number of events generated by a firewall or firewall deployment using the FMC. Note that these calculations are partially dependent on the FMC event database settings, which were covered in a prior section. The event views in your FMC will depend on platform (FMC or Cloud Delivered FMC) and version. This guide covers how to calculate EPS using different events views.
For exact counts, using the Analysis > Events methodology is recommended (only available in FMC). For a count of all event types, the unified events methodology is recommended.
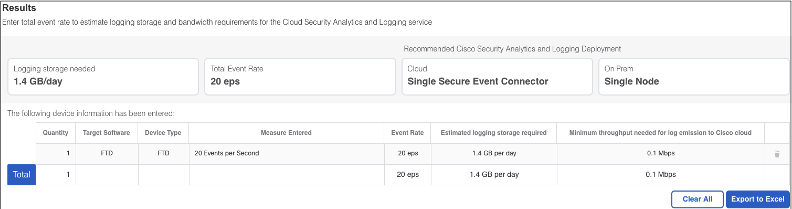
Once you have an exact EPS count you can return to the logging calculator to get a rough estimate of total data ingest. Here is an example logging estimate for 20 EPS.
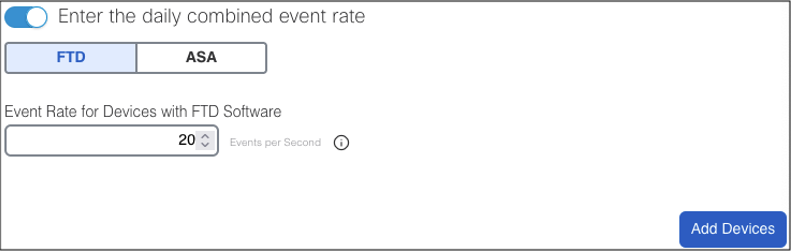
The above returns an estimate of 1.4 GB ingest.
Unified Events
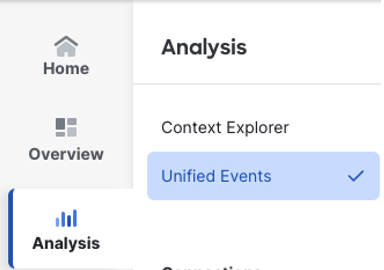
Navigate to Analysis > Unified Events in the FMC, or Events & Logs > Firewall Threat Defense in cdFMC (note: unified events have not been rolled out to all cdFMC tenants at the time of this writing).
The initial search will run for a period of the last hour and return up to 10,000 events.

Reviewing the above, we can see that 10,000 events were generated in the 1 hour period, and all of them were connection events (the box on the far left). This gives us an estimate of our connections per second, though we need to keep in mind that traffic levels can vary greatly depending on the time of day. Because our event results are already at the maximum of 10,000, there isn’t any use in expanding our time window—since 10,000 events is the maximum returned, expanding our time window will still result in 10,000 events.
Let’s reduce the time window until we get fewer than 10,000 events.

We’ll set a Fixed Time Range and configure a time window of just 5 minutes.
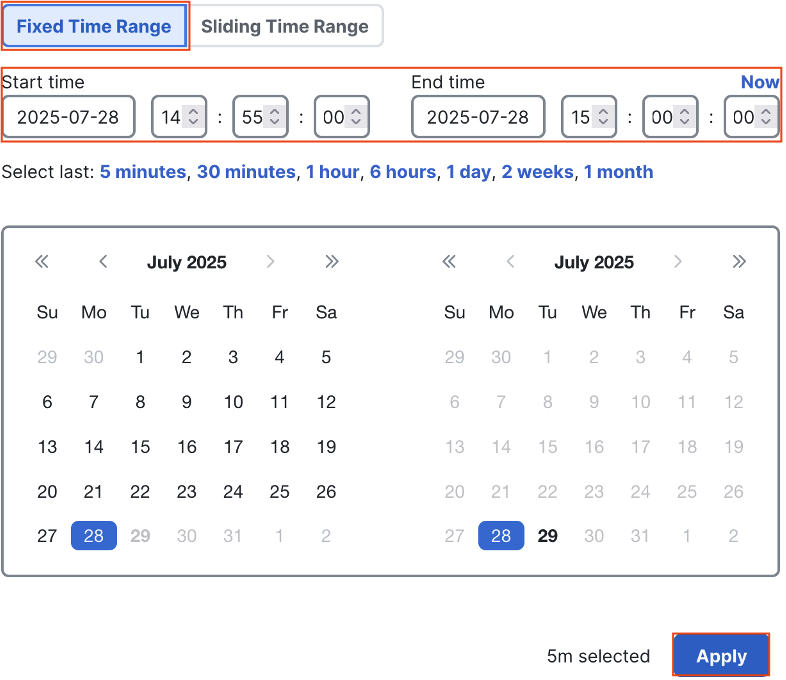

This search returned 3,565 events. Because this is less than 10,000, we know that this is an accurate event rate.
NOTE
When searching, be aware that events could have been pruned during the time window; it’s advisable to search in the past to confirm that events were not recently pruned. For example, if we search from 12:00:00 to 13:00:00 > > and return no events, we know that all of the events in that time frame were pruned. This means that some or all > of the events from 13:00:00 to 14:00:00 could have been pruned as well.
We can use the 3,565 event total to estimate EPS. 5 minutes x 60 seconds = 300 seconds, and 3,565 events / 300 seconds is an EPS of 11.88. However this is only one sample, so it would be wise to take multiple samples across both peak and non-peak hours and then average them together to get a more accurate EPS.
Calculating Threat EPS with Unified Events
We can calculate EPS for only threat events using unified events. To do this, we simply click the event icons for security intelligence, intrusion, file, and malware.

This adds each category to the search filter as shown.

This search returned no events. We’ll do a full 24 hour search (preferably not including a weekend) so we can make an accurate EPS estimate.
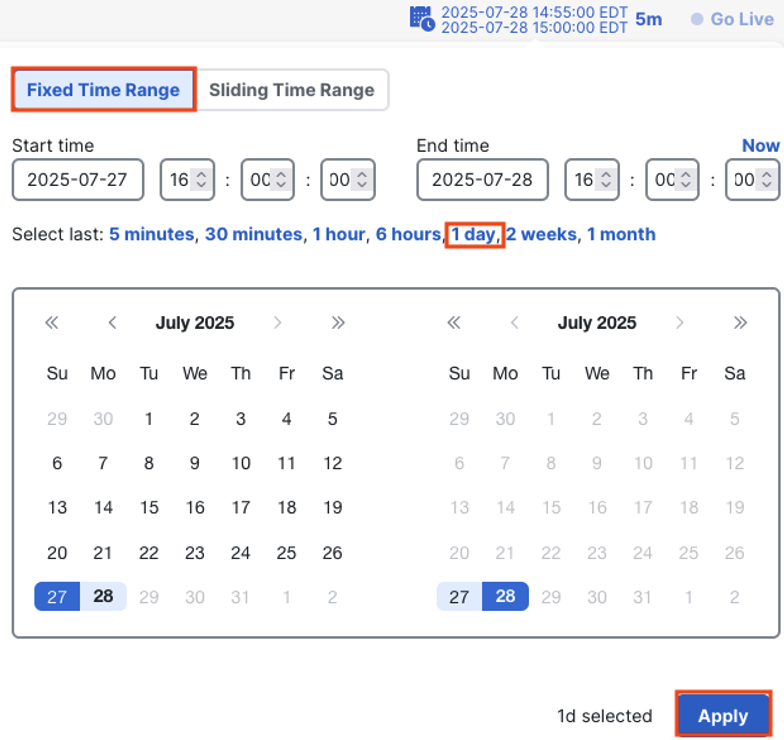
This search returned 3,498 events.

Because the event count is under 10,000 and each of these event types has a default database of over 10,000, we know that these event results are accurate and free of any pruning. If the search results returned exactly 10,000 events, we would need to reduce our search window until we returned less than the 10,000 Unified event limit.
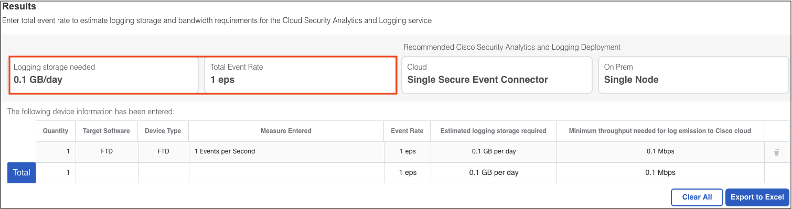
With 3,498 events over a 1 day time frame, we can calculate EPS. 3,498 events in a day / 86,400 seconds in a day (24 hours x 60 minutes x 60 seconds) yields .04 EPS. Our logging estimator doesn’t accept values less than one, but if we calculate an EPS of 1 it results in an estimate of .1 GB a day, a very manageable number.
Calculating Events per Second with Analysis > Events
This is an optional workflow that is an alternative to the steps provided for unified events in the prior section. This workflow isn’t available for cdFMC, but it is useful for accurately counting a single event type in a given period. We’ll use security intelligence events for this example, and the steps can be copied for counting intrusion, file, malware, and other event types. We’ll do a separate calculation for connection events in the next section, as these are more difficult due to frequent pruning.
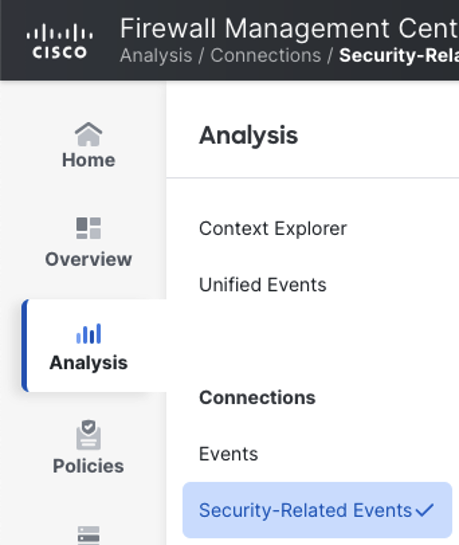
In the FMC, navigate to Analysis > Connections > Security-Related Events.
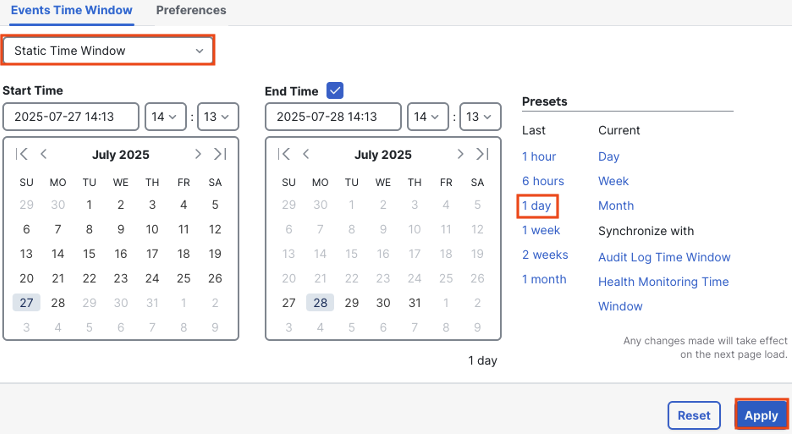
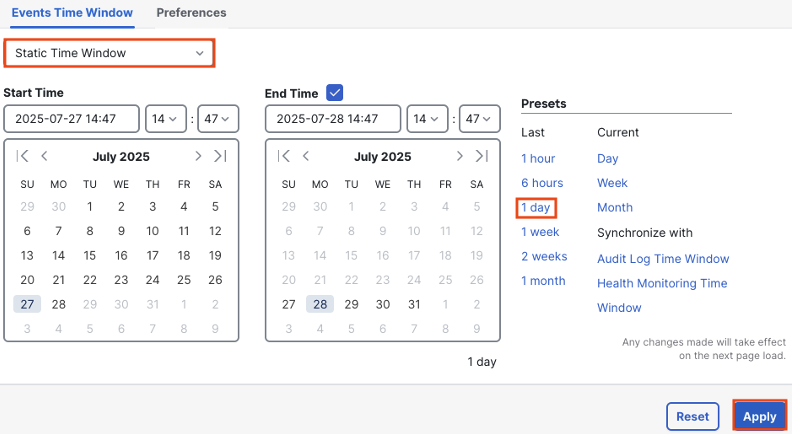
Click on the timestamp in the top right.

We want a precise time frame, so select Static Time Window in the top left, and choose a preset timeframe. While a 1 hour time frame can be useful, it’s recommended to use 1 day so that we can get an average of events across both peak and off hours. Click Apply.
For this lab deployment we only have 8 events across the 24 hour time period.
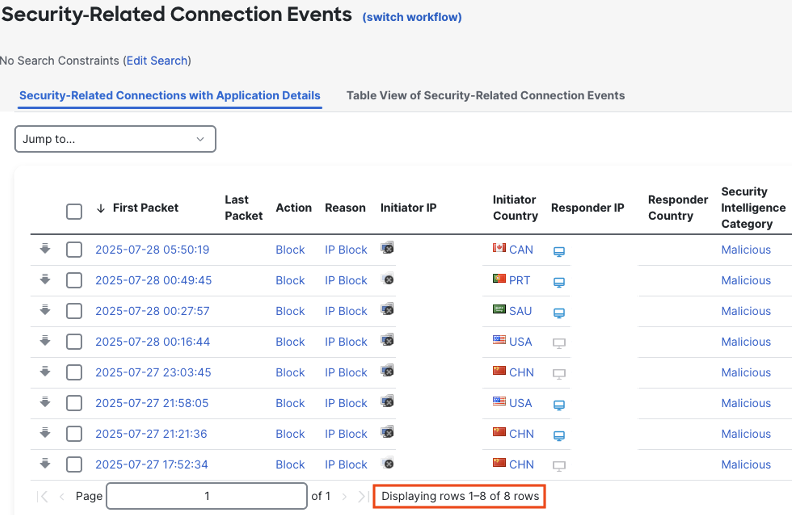
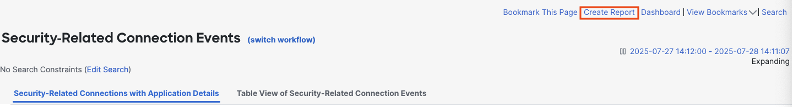
If we had significantly more, we could determine EPS by dividing the total number of events in the 24 hour period by 86,400 (24 hours x 60 minutes x 60 seconds). If the event total is larger than expected or we want to identify tuning opportunities, we can use the report generator. Note that the above event set contains only one security intelligence category—malicious. Security intelligence events can be high volume, and that volume could be driven significantly by one category, or even a single IP within a single category. Click on Create Report.
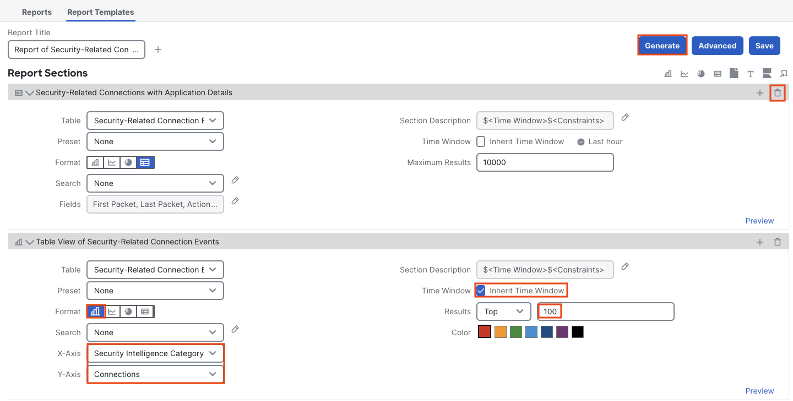
Click the trash icon in the top right to remove the application details report. For the table view section, set the format to bar chart, the X-Axis to security intelligence category, and leave the Y-Axis on connections. Check the box to inherit time window (the time frame from our prior search) and set the results to 100 (the maximum allowed for bar charts). Click Generate.
Name the report if desired, select an output format, then click Generate again.
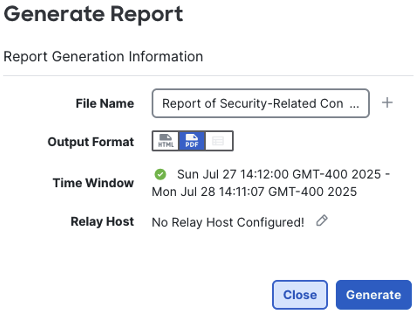
You’ll be prompted that generating will also save the report, click OK. A popup will appear that provides a link to the report, and you can also open the report from Tasks in the top right menu.

Here we can sort the top 100 categories by number to identify any that might need pruning. As we knew already, there are only 8 events in this set.
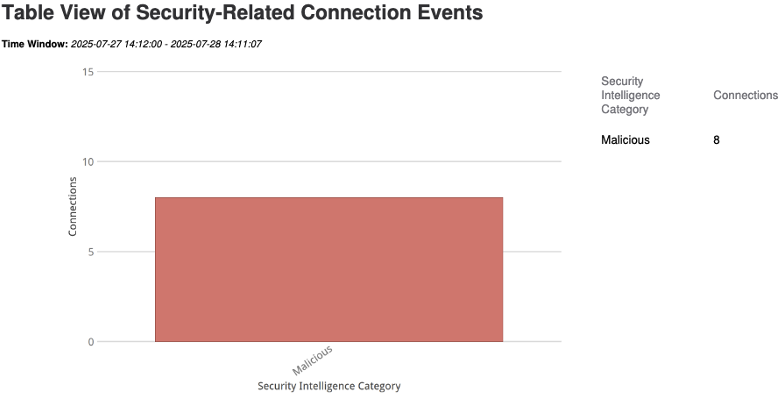
The same methodology can be used to identify the top 100 IPs by event count or the total number of events per firewall, simply by changing the X-Axis to the desired value before generating the report. This can be very useful when looking for tuning opportunities or trying to understand the makeup of a large event set.
Calculating Events per Second with Analysis > Connections > Events
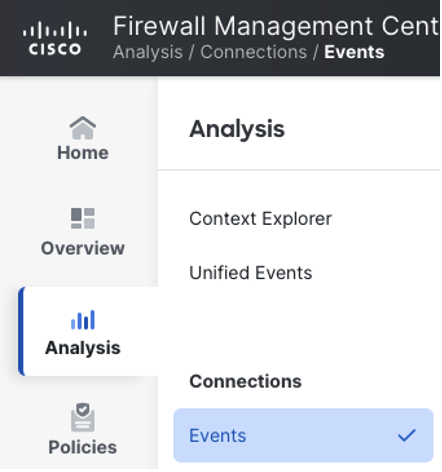
This is also an optional workflow that is an alternative to the steps provided for unified events in the prior section. Calculating EPS for environments that exceed the connection events database in under 24 hours can be tricky, and requires techniques that differ from the prior section. In the FMC, navigate to Analysis > Connections > Events.
Click the timestamp.

Set a static time window and the 1 day preset, then click Apply (ideally this should be done when it captures a baseline for a full business day, so avoid Mondays for most environments).
Scroll down to the bottom of the page.
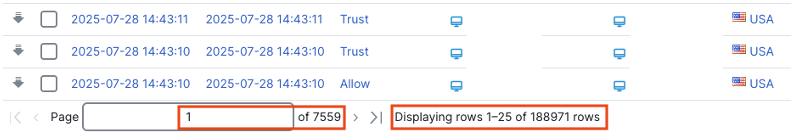
The numbers at the bottom of the page tell us that we’re viewing page 1 of 7,559 pages. Each page in our result set contains 25 events/rows (Displaying rows 1-25), and there are 188,971 events/rows total in our 1 day search window. If we apply our EPS methodology and divide by 86,400 (24 hours x 60 minutes x 60 seconds), we get an average of 2.19 EPS for this deployment for connection events (note that this is only for connection events and other event types would need to be added for true EPS, but connection events should be by far the largest data set).
This is straightforward, but there are some potential complications. For example, what if we had our connection event database set to 5,000,000, and our search results returns ‘Displaying rows 1-25 of 5000000 rows? (Note: the FMC will likely show ‘Displaying rows 1-25 of many rows when returning a very large number of events.)

That would mean that we hit our database limit in the 1 day time frame, and some or many events could have been pruned.
How do we verify? First, we need to know what our database limit is, so refer to the section on event databases if needed. Next, we can sort the connection events to see when the oldest event occurred. For high traffic environments that consistently get new events every second, this will accurately show us the point when events were last pruned.
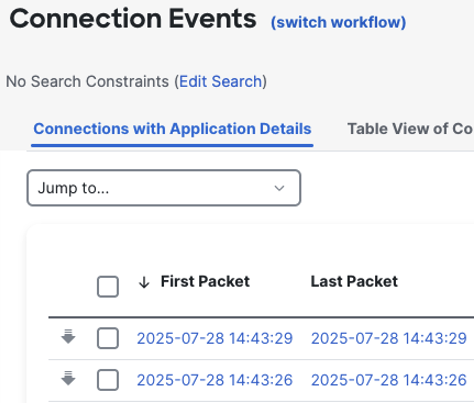
Scroll back to the top of the page. By default, connection events will show the latest event first.
If we click on first packet, the search will flip and show the earliest event.
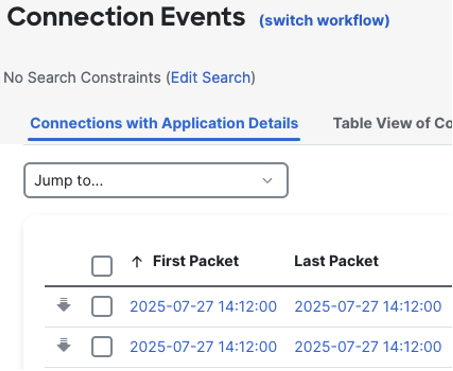
Note that the arrow by first packet flipped, and the event timestamps changed. The new timestamp exactly matches our search window in the top right.
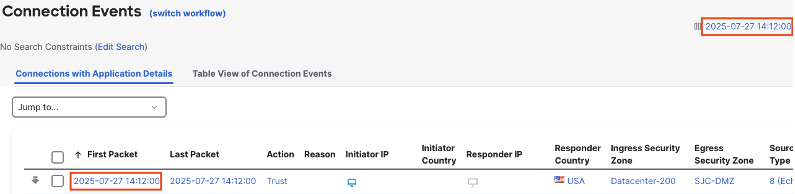
This confirms that our search is returning a full day worth of connection events, and none were pruned. If the timestamp of the earliest event did not match the beginning timestamp of our search, it would mean that either (a) no traffic was occurring at that time, or (b) that events have been pruned within the timeframe. For example, if the first packet had a timestamp of 18:12:00 and our one day search window started at 14:12:00, then we would know that 4 hours of events were pruned.

In this case, we would either need to take periodic event counts (e.g. every 8 hours) to get a full 24 hour sample, or rely on estimation.
Beginning or End of Connection Logging
Many event types—including intrusion, malware, and security intelligence events—are triggered by a specific action and generate a log with all of the relevant details for that action. For example, an intrusion event is generated when a potentially malicious action that matches a Snort rule is detected, and the corresponding event will include the alerting packet and all associated details.
In contrast, most connection related events (including logs for the access control policy and prefilter policy) have a ‘Log at beginning of connection’ and ‘Log at end of connection’ option. Any admin with a packet level understanding of network protocols will be able to grasp the key differences between beginning and end of connection logging, but there are some nuances that should be understood.
Beginning of Connection Logging
This setting will generate a log for a connection as soon as the connection matches a rule (access control rules are the most common, but this can also apply to prefilter and decryption rules). For example, if there is an access control policy (ACP) rule that matches any traffic with a destination port of TCP 443, then the rule will match on the SYN packet in an HTTPS connection, and a beginning of connection log can be generated. A beginning of connection log generated at this stage can have dozens of fields containing valuable data, including:
• Source IP
• Destination IP
• Protocol (TCP)
• Source port (ephemeral port is expected for HTTPS)
• Destination port (443)
• Timestamp for when the connection was attempted
• Firewall action for the connection (Allow, Block, etc.)
• Access Control rule that the connection matched
• Access Control policy that the connection was evaluated against
• Firewall that the connection passed through
• And many more
Each of the datapoints above provides useful and granular information about a given connection.
End of Connection Logging
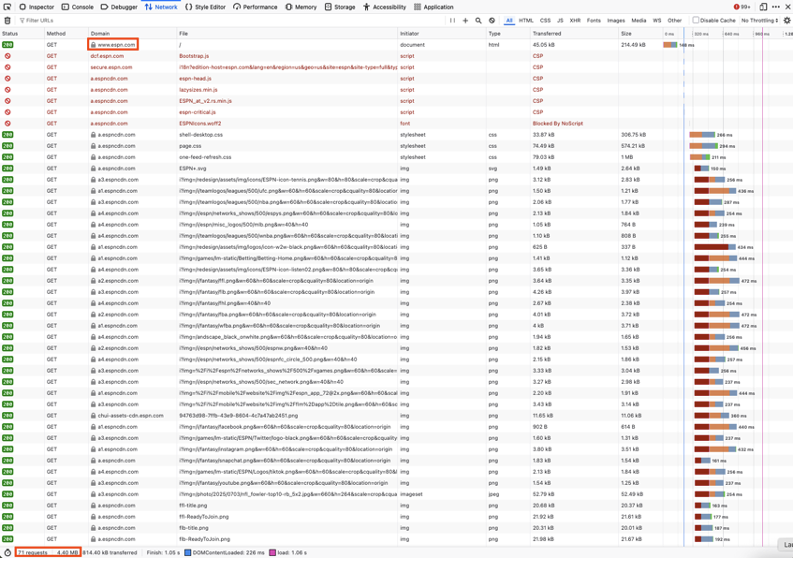
Re-using the HTTPS connection example from the prior section, let’s consider it for end of connection logging. The connection will match an ACP rule on the SYN packet, but then we also expect to see a responding ACK, a SYN/ACK, the building of an HTTPS session with packets like client hello, server hello, and certificate key exchange, and then finally all of the encrypted packets associated with the actual HTTPS request. These can be substantial and long running. As an example, if we issue one HTTPS request for espn.com, by the time the page loads, a total of 71 requests will transpire for resources including javascript, css, fonts, and page images totaling over 4MB.
All of the data that is generated over the course of a long connection is lost to us if we use beginning of connection logging. End of connection logging can capture all of the fields associated with beginning of connection logging and many more:
• Total initiator packets (this would be 1 with beginning of connection logging, the SYN)
• Total responder packets (this would be 0 for beginning of connection logging)
• Total initiator bytes (even though most of the traffic is encrypted, we can still see how much data was passed)
• Total responder bytes
• Server information we can gain from the unencrypted packets like the certificate key exchange
• And many more
Additional Considerations for Beginning or End of Connection Logging
From the prior sections it should be clear that end of connection logging has significant data capture benefits over beginning of connection logging. However, there is a consideration that can be very significant for troubleshooting, and potentially for threat investigations as well. Some connections can run for a very long time. These can include benign sessions that are often better to exclude from logging, like backups. But they can also include connections with business relevance. For example, the Expressway components of a Cisco voice over IP (VoIP) deployment can create connections that run for multiple days. A NOC trying to validate that such a connection was established will probably not be able to rely on an end of connection event, since they won’t have a log until the connection terminates. Similarly, remote access connections such as SSH could run for a significant amount of time before generating an end of connection log. This has implications for SOC monitoring and incident response.
While it is possible to generate both beginning and end of connection logs for many connections, this is discouraged in most cases because it doubles the amount of connection events produced by the firewall. While end of connection logs are preferable in most circumstances, admins should consider whether threat or troubleshooting considerations make beginning of connection logs preferable for some connections. Effort should also be taken to ensure NOC and SOC personnel are aware of what logs are available to them and what the considerations are for their workflows.
For steps to configure external logging settings, please see the External Logging Configuration guide.
Updated 10 months ago