
Advanced Logging
Introduction
Cisco Secure Firewall 10.0 introduces advanced logging, a powerful new capability that emits structured, protocol-aware telemetry directly from the Snort inspection engine. Instead of relying solely on outcome-focused firewall events, advanced logging records the underlying network conversations: connections, DNS exchanges, HTTP transactions, and other protocol behaviors and anomalies that carry valuable security context.
This level of visibility has historically depended on dedicated network analytics tooling, but is now available natively on Firewall Threat Defense, making Cisco the only enterprise firewall platform to offer this class of protocol-level telemetry out of the box. The result is deeper operational insight for security teams, enabling more confident threat hunting, incident response, and forensic analysis without adding separate sensors or infrastructure.
Background
Traditional firewall logs are optimized around enforcement decisions: what was allowed, what was blocked, and which policy rule applied. However, the Snort engine continuously observes far more about a connection than is captured in those summaries. Every DNS lookup, HTTP request, handshake, or protocol irregularity carries signals about intent, software behavior, and potential compromise.
Historically, organizations turned to out-of-band IDS and analytics tools—such as Zeek—to collect and interpret this protocol-level data. With advanced logging, the firewall now becomes a native source of rich network telemetry. This reduces architectural complexity while preserving the level of detail analysts expect from specialized observability platforms.
Requirements and Limitations
The following requirements and limitations apply:
- Advanced logging requires Firewall Management Center (FMC) 10.0 or later for configuration. Cloud-Delivered Firewall Management Center (cdFMC) is also supported beginning with the December 2025 release.
- Managed devices must be running Firewall Threat Defense (FTD) 10.0 or later. Configurations applied to devices running older versions of code will be ignored.
- Firewall Device Manager (FDM) is not supported.
- Advanced logging is designed to be exported over syslog only. Sending advanced logging events to FMC or cdFMC is not supported. Ensure that a syslog destination (such as Splunk) is configured to receive the telemetry.
- For Splunk environments, the latest release of the Cisco Security Cloud app is recommended to enable automated parsing and normalization of the new event formats.
- Advanced logging does add processing requirements and may introduce approximately 10-20% additional CPU utilization on the firewall. Cisco recommends enabling it incrementally within rules, and consulting Cisco TAC or your account team for performance considerations in large-scale or performance-sensitive deployments.
Advanced Logging Setup
Configuring advanced logging is a two-step process. First, the feature is activated at the policy level. Then, advanced logging is enabled on individual access control rules.
Activating advanced logging in policy
Follow these steps to activate advanced logging at the policy level:
-
Navigate to Policies > Access Control. Select an existing access control policy, or choose Create Policy to define a new one.
-
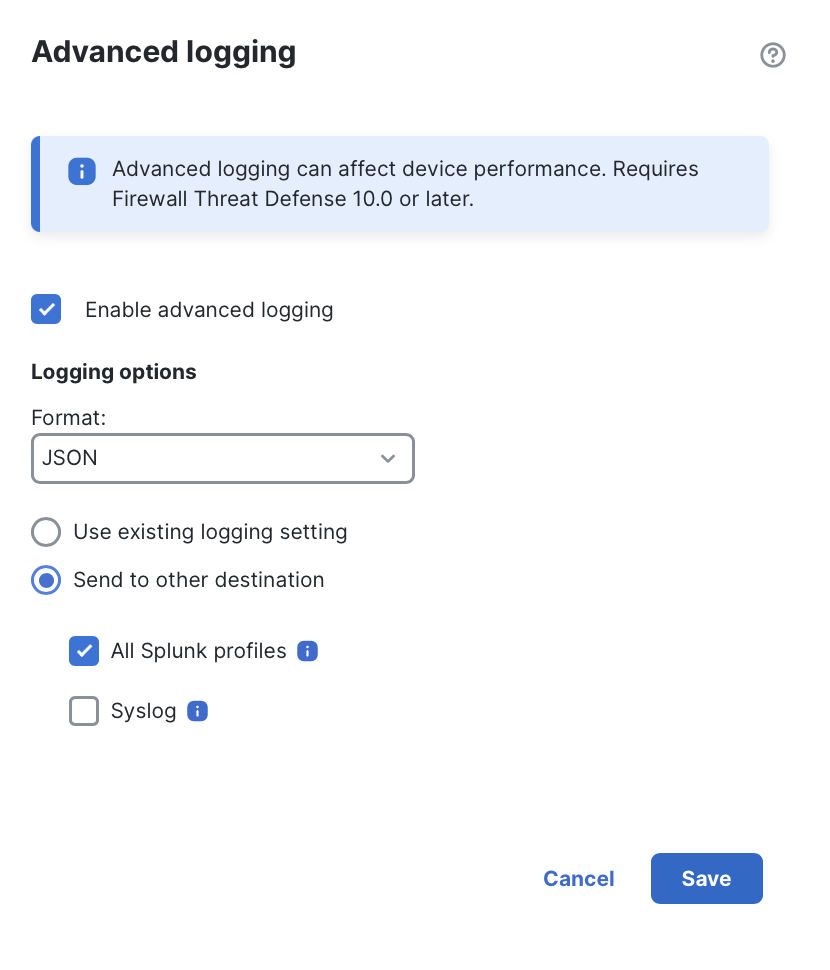
Navigate to More > Advanced Settings, scroll to the bottom of the page, and edit Advanced Logging. In the popup that appears, configure the following sections:
-
Enable advanced logging: Activates advanced logging for all FTD devices associated with the access control policy.
-
Format: Select JSON, CSV, or TSV. JSON is required for use with the Splunk Cisco Security Cloud app. For other SIEM platforms, consult the vendor's documentation regarding preferred formats. (In most deployments, JSON will be the recommended option.)
-
Use existing logging setting: Sends advanced logging events to the syslog destination configured under More > Logging.
-
Send to other destination: Overrides the logging destination configured under Logging, allowing advanced logging to be sent elsewhere. Select one or both of the following:
- All Splunk profiles: Sends events to all Splunk destinations configured under Integrations > Splunk.
- Syslog: Select a configured syslog server other than the one configured under Logging. (To create a new syslog destination, navigate to Administration > Alerts > Create Alert > Create Syslog Alert.)
-
-
Click Save in the popup, then Save the access control policy.
After policy deployment, the advanced logging capability becomes active for all assigned devices. However, no advanced logging events will be generated until explicitly enabled on individual access control rules, as described in the next section.
Enabling rules for advanced logging
After advanced logging has been activated in an access control policy, individual rules can be enabled for the specific advanced logs you want to collect. Open your access control policy and edit any rule where advanced logging should apply. A new Advanced logging option will appear within the rule editor, initially set to OFF. Click this option and select the event types you wish to log.
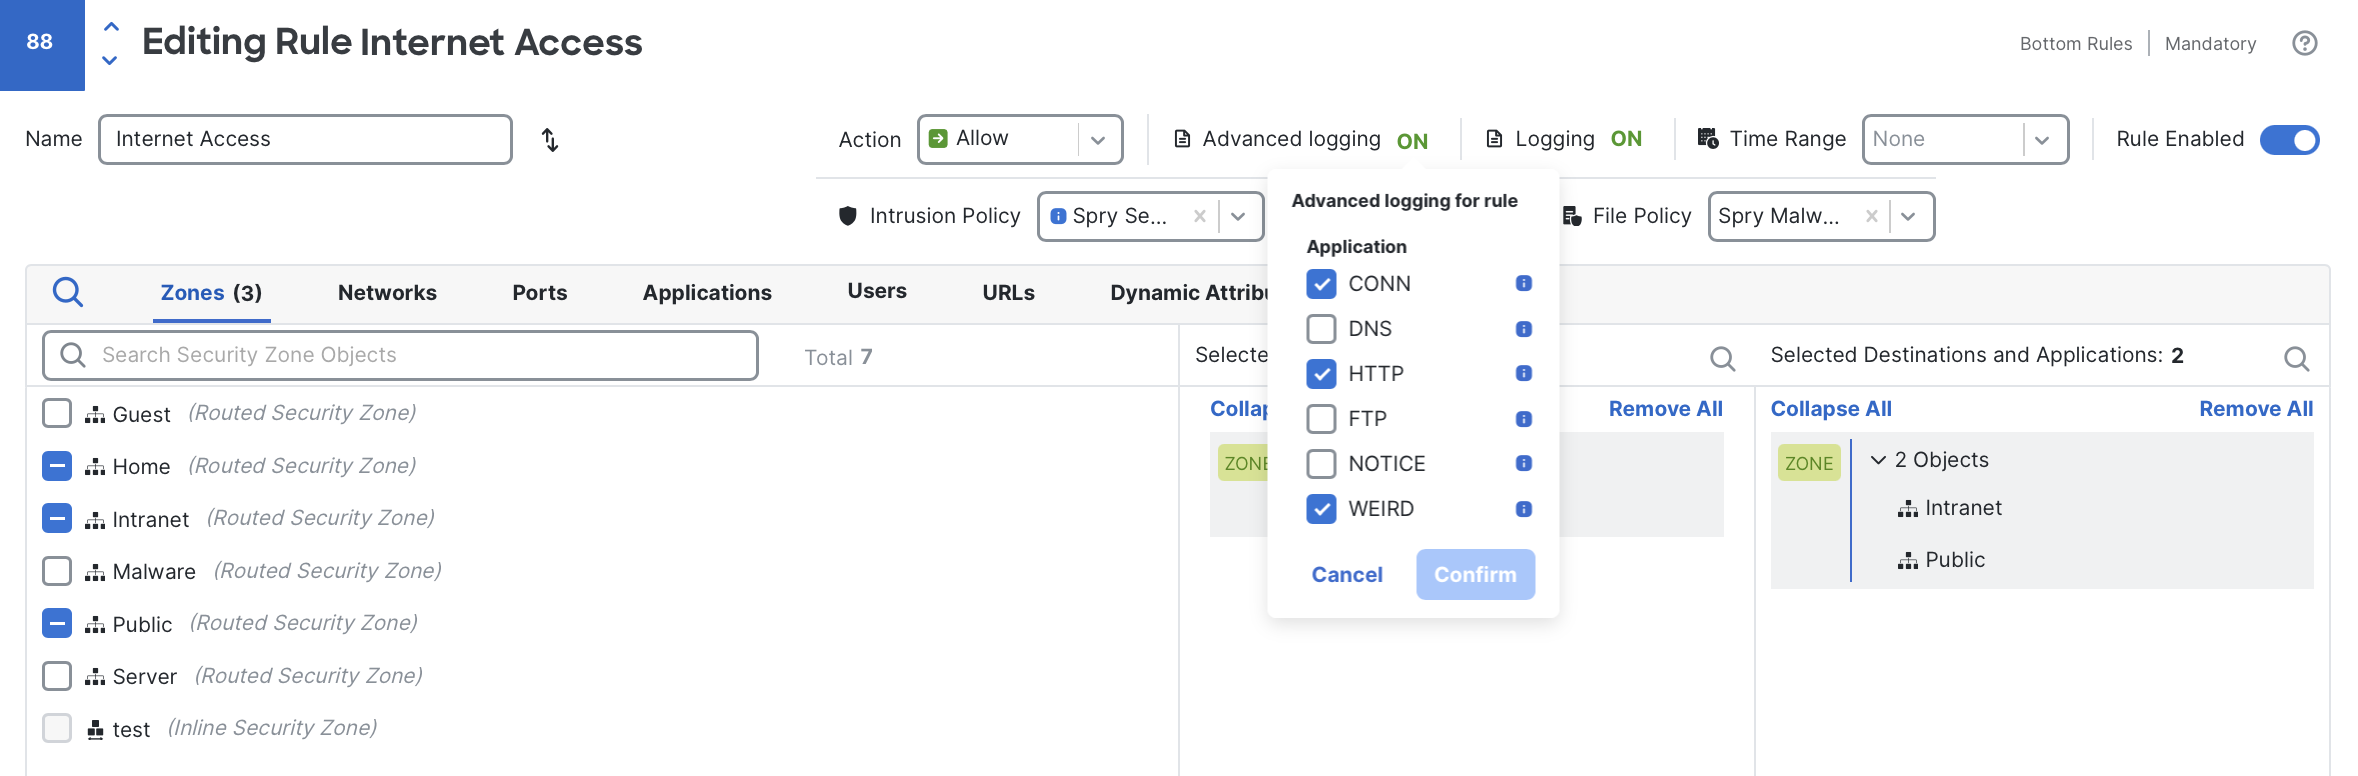
For this example rule, I have selected CONN, HTTP, and WEIRD logging.
On the main access control policy page, rules that have advanced logging enabled are marked with the advanced logging icon to the right of the regular logging icon:
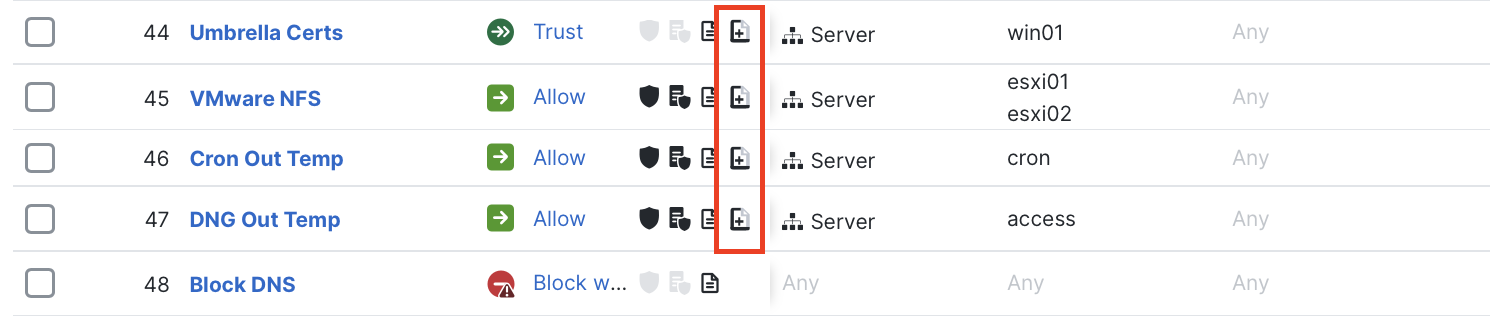
This icon indicates that advanced logging is enabled.
Any changes made to rule-level advanced logging take effect after the next firewall policy deployment.
Log Types Explained
Advanced logging currently supports six protocol-focused log types, each exposing commonly used fields for security analytics. (Additional protocols and field coverage are planned for future releases.) The formats are intentionally aligned to the conventions used by IDS platforms that leverage Zeek, making the resulting telemetry straightforward to consume in existing SOC and network security workflows.
Depending on your objectives, these event types may be used alongside standard connection event logging, integrated into advanced network telemetry pipelines, or leveraged independently as a new source of protocol-rich visibility.
CONN
CONN records every observed connection (TCP, UDP, and ICMP) traversing the firewall. It is the foundational advanced logging type and serves as the parent record for the other protocol logs. CONN captures the basic layer-4 parameters of a connection and includes a unique numeric UID that correlates related events across protocol types for the same connection.
The table below lists the CONN fields and their correspondence to standard connection event fields:
| CONN field | Field description | Connection event equivalent | Example |
|---|---|---|---|
| ts | Timestamp | FirstPacketSecond | 1764957940.423394 |
| uid | Connection ID | ConnectionID | 332174096 |
| id.orig_h | Source IP | InitiatorIP | 10.100.100.52 |
| id.orig_p | Source port | InitiatorPort | 59380 |
| id.resp_h | Destination IP | ResponderIP | 1.2.3.4 |
| id.resp_p | Destination port | ResponderPort | 443 |
| proto | Protocol | Protocol | TCP |
| service | Service | Application | http2 |
| duration | Duration | ConnectionDuration | 26 |
| orig_bytes | Bytes sent | InitiatorBytes | 18938 |
| resp_bytes | Bytes received | ResponderBytes | 43043 |
| orig_packets | Packets sent | InitiatorPackets | 61 |
| resp_packets | Packets received | ResponderPackets | 63 |
| conn_state | Connection state | N/A | CLT_TCP_CLOSED SRV_TCP_CLOSED |
| history | Connection history | N/A | SADRhdf |
Two additional fields provided by CONN—conn_state and history—expose information not found in standard connection events:
- conn_state: indicates how a connection terminated. In the example above, both client and server closed the session normally.
- history: captures the full lifecycle of a connection using concise client and server flags. In the example above (
SADRhdf) we observe:- TCP handshake: client S (SYN), server h (SYN-ACK), client A (ACK)
- Data exchange: client D (data), server d (data)
- Session end: server f (FIN), client R (RST)
Zeek documentation provides a comprehensive history-flag reference.
DNS
DNS records every DNS query and response, providing full visibility into domain lookups, returned answers, and accompanying protocol metadata, at a far richer level of detail than is available from traditional connection events. Each DNS entry is correlated with its parent CONN record through the shared UID, allowing queries and responses to be linked directly to the originating connection.
The table below shows the DNS fields and how they map to similar fields in standard connection events:
| DNS field | Field description | Connection event equivalent | Example |
|---|---|---|---|
| ts | Timestamp | FirstPacketSecond | 1764957940.423394 |
| uid | Connection ID | ConnectionID | 332174096 |
| id.orig_h | Source IP | InitiatorIP | 10.100.100.52 |
| id.orig_p | Source port | InitiatorPort | 59380 |
| id.resp_h | Destination IP | ResponderIP | 208.67.222.222 |
| id.resp_p | Destination port | ResponderPort | 53 |
| proto | Protocol | Protocol | UDP |
| trans_id | Client transaction ID | N/A | 51878 |
| query | Query domain | DNS_Query | talosintelligence.com |
| qclass | Query class | N/A | 1 |
| qclass_name | Query class name | N/A | C_INTERNET |
| qtype | Query type | N/A | 1 |
| qtype_name | Query type name | DNS_RecordDescription | A |
| rcode | Response code | N/A | 0 |
| rcode_name | Response code name | DNS_ResponseType | NOERROR |
| AA | Authoritative answer (bool) | N/A | F |
| TC | Truncated message (bool) | N/A | F |
| RD | Recursion desired (bool) | N/A | T |
| RA | Recursion available (bool) | N/A | T |
| Z | Reserved bits | N/A | 0 |
| answers | Response answers | N/A | 104.16.219.84 104.16.218.84 |
| TTLs | TTLs for each answer | DNS_TTL | 178 178 |
| rejected | Rejected query (bool) | N/A | F |
| auth | Authoritative responses | N/A | fiona.ns.cloudflare.com |
| addl | Additional responses | N/A | OPT 0 0 |
DNS logs introduce several fields that meaningfully expand visibility into DNS activity on the network. Some of the most valuable include:
- answers: Lists the returned resource records, allowing you to correlate DNS resolutions with subsequent outbound connections, or detect cases where resolved domains never result in follow-on traffic.
- TTLs: Provides per-answer TTL values, enabling detection of behaviors such as fast-flux hosting or unusually short-lived DNS records.
- TC, Z and other flag bits can highlight anomalies such as message truncation (useful for detecting potential DNS exfiltration techniques), non-standard protocol behavior, and other suspicious conditions.
FTP
FTP records detailed command and response exchanges within the FTP protocol, including authentication attempts, file transfers, and basic directory operations. Each FTP interaction within a single parent connection is logged individually, and all entries are correlated with one another (and with the parent CONN event) through the shared UID.
The table below shows the FTP fields and their correspondence to similar fields in connection events:
| FTP field | Field description | Connection event equivalent | Example |
|---|---|---|---|
| ts | Timestamp | FirstPacketSecond | 1764957940.423394 |
| uid | Connection ID | ConnectionID | 332174096 |
| id.orig_h | Source IP | InitiatorIP | 10.100.100.52 |
| id.orig_p | Source port | InitiatorPort | 54804 |
| id.resp_h | Destination IP | ResponderIP | 1.2.3.4 |
| id.resp_p | Destination port | ResponderPort | 21 |
| command | FTD command | N/A | CWD |
| arg | Command argument | N/A | /Documents/ |
| reply_code | Reply code | N/A | 250 |
| reply_msg | Reply message | N/A | CWD command successful |
| file_size | File size in bytes | (In File Event) | 19968 |
| data_channel.passive | Passive data mode (bool) | N/A | true |
| data_channel.orig_h | Data channel source IP | N/A | 10.100.100.52 |
| data_channel.resp_h | Data channel destination IP | N/A | 1.2.3.4 |
| data_channel.resp_p | Data channel destination port | N/A | 45006 |
| user | FTP session user name | N/A | barry.johnson |
FTP logs expose significantly more protocol detail than standard connection events. Notable fields include:
- command and arg: Provide a transcript of commands issued to the FTD server. These can reveal data-movement behavior, the use of plain-text credentials, and other operational or security risks.
- user: Captures the actual FTP session username, whereas connection events typically reflect the endpoint's logged-in username rather than the application-layer identity.
- reply_code and reply_msg: Surface error conditions or authentication patterns that may indicate password guessing, misconfigurations, or unexpected server behavior.
HTTP
HTTP records each HTTP request and response and includes extensive metadata for every transaction. Multiple HTTP/2 requests that occur within a single TCP connection are captured together, and all HTTP entries are correlated with the parent CONN record using the shared UID.
The table below lists the HTTP fields and how they relate to similar attributes in connection events:
| HTTP field | Field description | Connection event equivalent | Example |
|---|---|---|---|
| ts | Timestamp | FirstPacketSecond | 1764957940.423394 |
| uid | Connection ID | ConnectionID | 332174096 |
| id.orig_h | Source IP | InitiatorIP | 10.100.100.52 |
| id.orig_p | Source port | InitiatorPort | 54804 |
| id.resp_h | Destination IP | ResponderIP | 1.2.3.4 |
| id.resp_p | Destination port | ResponderPort | 443 |
| method | HTTP method | N/A | GET |
| host | Host | ReferencedHost | example.com |
| uri | URI path | URL | /downloads/index.html |
| user_agent | User agent | UserAgent | Mozilla/5.0 (Macintosh; Intel Mac OS X 10.15; rv:145.0) Gecko/20100101 Firefox/145.0 |
| referrer | Referrer | HTTP_Referer | https://www.cisco.com |
| origin | Origin header | N/A | https://www.example.com |
| version | HTTP version | N/A | 2.0 |
| status_code | HTTP status code | HTTP_Response | 200 |
| status_msg | HTTP status message | N/A | OK |
| trans_depth | Requests in session | N/A | 1 |
| request_body_len | Request body length | N/A | 0 |
| response_body_len | Response body length | N/A | 571305 |
| info_code | Server status code | N/A | 0 |
| info_msg | Server status message | N/A | Switching Protocols |
| proxied | Proxy headers | N/A | X-FORWARDED-FOR>192.168.1.50 |
| orig_filenames | Uploaded file names | (In File Event) | upload-file |
| resp_filenames | Downloaded file names | (In File Event) | download-file.txt |
| orig_mime_types | Uploaded file types | N/A | application/octet-stream |
| resp_mime_types | Downloaded file types | N/A | text/plain |
HTTP logs expose detailed attributes that greatly expand visibility into web traffic, particularly when decryption is enabled. Notable fields include:
- method: Captures the HTTP verb (GET, POST, PUT, etc.), which can surface uncommon or risky operations (for example, PUT is rarely seen in typical browsing and may indicate tool usage or administrative activity).
- request_body_len and response_body_len: Reflect message-body sizes rather than total connection volume, enabling detection of behaviors such as exfiltration, large payload transfers, anomalous GET requests, or beaconing patterns.
- version: Identifies the HTTP protocol version, which can help uncover outdated tooling, protocol downgrades, or unexpected HTTP/1.x usage on networks where HTTP/2 should be dominant.
WEIRD
WEIRD records unusual or anomalous network behavior that does not conform to expected protocol norms. These events are generated by built-in Snort inspector rules. Snort includes dozens of protocol-specific inspectors, each with multiple rules designed to detect protocol deviations, unexpected states, or malformed activity. (Learn more about Snort inspectors here).
Although it is technically possible to log these built-in rules through intrusion policy, doing so generally increases noise in intrusion workflows. Enabling the WEIRD event type instead provides a clean separation, allowing protocol anomaly information to be collected without impacting traditional intrusion analysis.
The table below shows WEIRD fields and their alignment to comparable intrusion event attributes (when enabling built-in intrusion rules explicitly):
| WEIRD field | Field description | Intrusion event equivalent | Example |
|---|---|---|---|
| ts | Timestamp | FirstPacketSecond | 1764957940.423394 |
| uid | Connection ID | ConnectionID | 332174096 |
| id.orig_h | Source IP | InitiatorIP | 1.2.3.4 |
| id.orig_p | Source port | InitiatorPort | 54804 |
| id.resp_h | Destination IP | ResponderIP | 10.100.99.20 |
| id.resp_p | Destination port | ResponderPort | 80 |
| proto | Protocol | Protocol | TCP |
| gid | Snort inspector ID | GeneratorID | 121 |
| sid | Snort rule ID | SignatureID | 38 |
| msg | Rule message | IntrusionRuleMessage | (http2_inspect) HTTP/2 non-Data frame longer than 63780 bytes |
| source | Snort inspector | N/A | http2_inspect |
NOTICE
NOTICE logs represent active alerts generated by intrusion policy. Unlike WEIRD events (which reflect protocol anomalies that may be benign), NOTICE events generally indicate an actual attack attempt or possible compromise.
NOTICE entries correspond directly to traditional intrusion events generated by the firewall, but are captured in a more compact format and aligned with related CONN, DNS, HTTP, and FTP records by means of the shared UID. This correlation helps analysts follow activity across protocol layers without jumping between unrelated log views.
The table below lists NOTICE fields and how they correspond to traditional intrusion event attributes:
| NOTICE field | Field description | Intrusion event equivalent | Example |
|---|---|---|---|
| ts | Timestamp | FirstPacketSecond | 1764957940.423394 |
| uid | Connection ID | ConnectionID | 332174096 |
| id.orig_h | Source IP | InitiatorIP | 1.2.3.4 |
| id.orig_p | Source port | InitiatorPort | 54804 |
| id.resp_h | Destination IP | ResponderIP | 10.100.99.20 |
| id.resp_p | Destination port | ResponderPort | 80 |
| proto | Protocol | Protocol | TCP |
| gid | Snort inspector ID | GeneratorID | 1 |
| sid | Snort rule ID | SignatureID | 58992 |
| rev | Snort rule revision | SignatureRevision | 1 |
| msg | Rule message | IntrusionRuleMessage | MALWARE-CNC User-Agent known malicious user-agent string - Mirai |
| refs | References | N/A | http//:www.virustotal.com/en/file/3908cc1d8001f926031fbe55ce104448dbc20c9795b7c3cfbd9abe7b789f899d/analysis/ |
| source | Snort inspector | N/A | http_inspect |
Performance Considerations & Best Practices
Advanced logging introduces additional processing on the firewall. Depending on traffic volume and the number of enabled log types, configurations may incur approximately 10-20% of additional CPU utilization, and in some cases more. Before enabling advanced logging in an existing deployment, review the current CPU usage and introduce the capability gradually to ensure the device remains within acceptable utilization levels (typically under 80%). CPU utilization for managed devices can be monitored under Troubleshooting > Health > Monitor, by selecting the relevant FTD device.
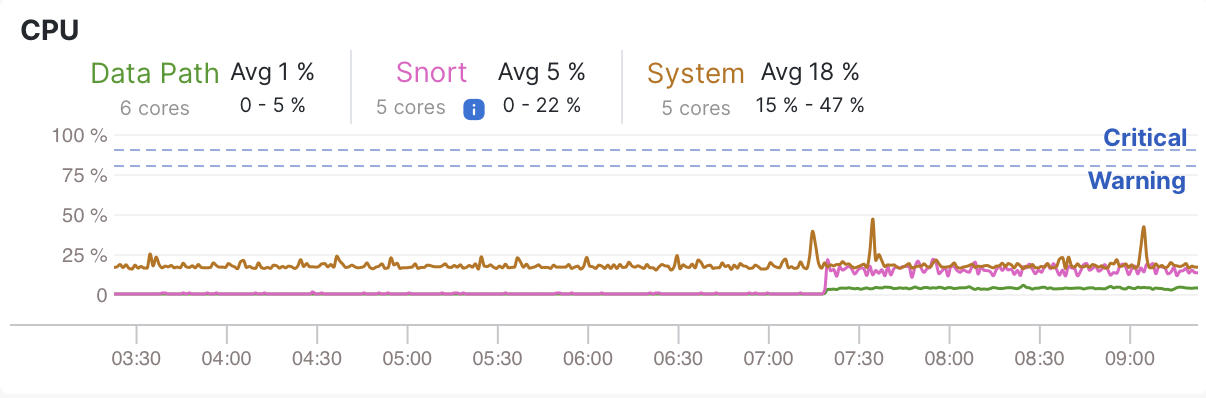
Health monitor CPU example
When selecting rules to enable for advanced logging, consider use cases where visibility provides the most investigative value. Common candidates include:
- rules that allow broad outbound access
- rules permitting inbound access to public-facing services (for example, web servers)
- rules governing traffic between peer networks (such as site-to-site VPNs).
When enabling protocol-specific logs, it is generally recommended to enable CONN events as well. CONN acts as the parent telemetry type and, via the UID, correlates all protocol logs for a given flow. For example, fully investigating a WEIRD anomaly over HTTP/2 may require reviewing the corresponding CONN, HTTP, and WEIRD events.
Use of the NOTICE event type should be limited to analysts performing advanced Zeek-style or advanced-logging-specific investigations. All NOTICE events correspond to traditional intrusion events that already exist, although they are not natively correlated via the UID. Manual correlation remains possible using the event's IPs, ports, and timestamps.
Finally, ensure you have a properly configured syslog destination. For Splunk, install the latest version of the Cisco Security Cloud app to enable automated parsing and normalization. Other syslog platforms may require custom parsing. Advanced logging emits encapsulated JSON by default, which simplifies parsing for most SIEM and syslog platforms, and CSV and TSV outputs are also supported.
Summary
Advanced logging extends the firewall's role in security operations by adding protocol-level visibility alongside traditional connection and security events. Once enabled and integrated into your SIEM, it becomes a natural part of everyday investigation, adding context where you need it, all without the need for additional infrastructure changes.
Updated 8 months ago