
SD-WAN Summary Dashboard
Introduction
With the advancements in WAN technologies, network deployments have become more complex. As a result, network administrators require solutions that provide simplicity in WAN management, complete visibility of the network, and ultimately reduce time to troubleshoot.
Thus, Cisco Secure Firewall Release 7.4 introduces the WAN summary dashboard that provides a holistic view of WAN devices and their associated interfaces in the deployment and aids in identifying issues related to devices and network paths that help network administrators take prompt recovery measures.
The dashboard provides network administrators with the following:
- A single dashboard that consolidates information from WAN devices e.g. device health, interface connectivity, application throughput, and VPN connectivity
- Ability to diagnose issues related to underlay and overlay (VPN) topologies
- Quick cross-launch that helps in faster troubleshooting for issues related to device health, device management, and VPNs
- Increasing uptime by continuous monitoring of links and prompt recovery measures
The WAN Summary dashboard refreshes itself every 5 minutes which can be changed to either 10, 15, or 30 minutes. Additionally, network administrators can turn off the Auto Refresh in case they are troubleshooting a network issue.
Note
For the data to be populated correctly on the WAN summary dashboard, a WAN device must meet one of the following criteria:
• The device is a VPN peer, or
• The device has an interface with path monitoring enabled, or
• The device has an egress interface that is monitored for at least one application in a PBR policy.Additionally, a WAN interface must meet one of the following criteria:
• An interface with based path monitoring enabled on it, or
• An interface having a PBR policy with at least one application monitoring it
This feature is supported with Secure Firewall Threat Defense running 7.2 and above and Cisco Secure Firewall Management Center running 7.4.
Dashboard Overview
The WAN Summary dashboard is accessible on Secure Firewall Management Center by navigating to Overview > Dashboards > WAN Summary.
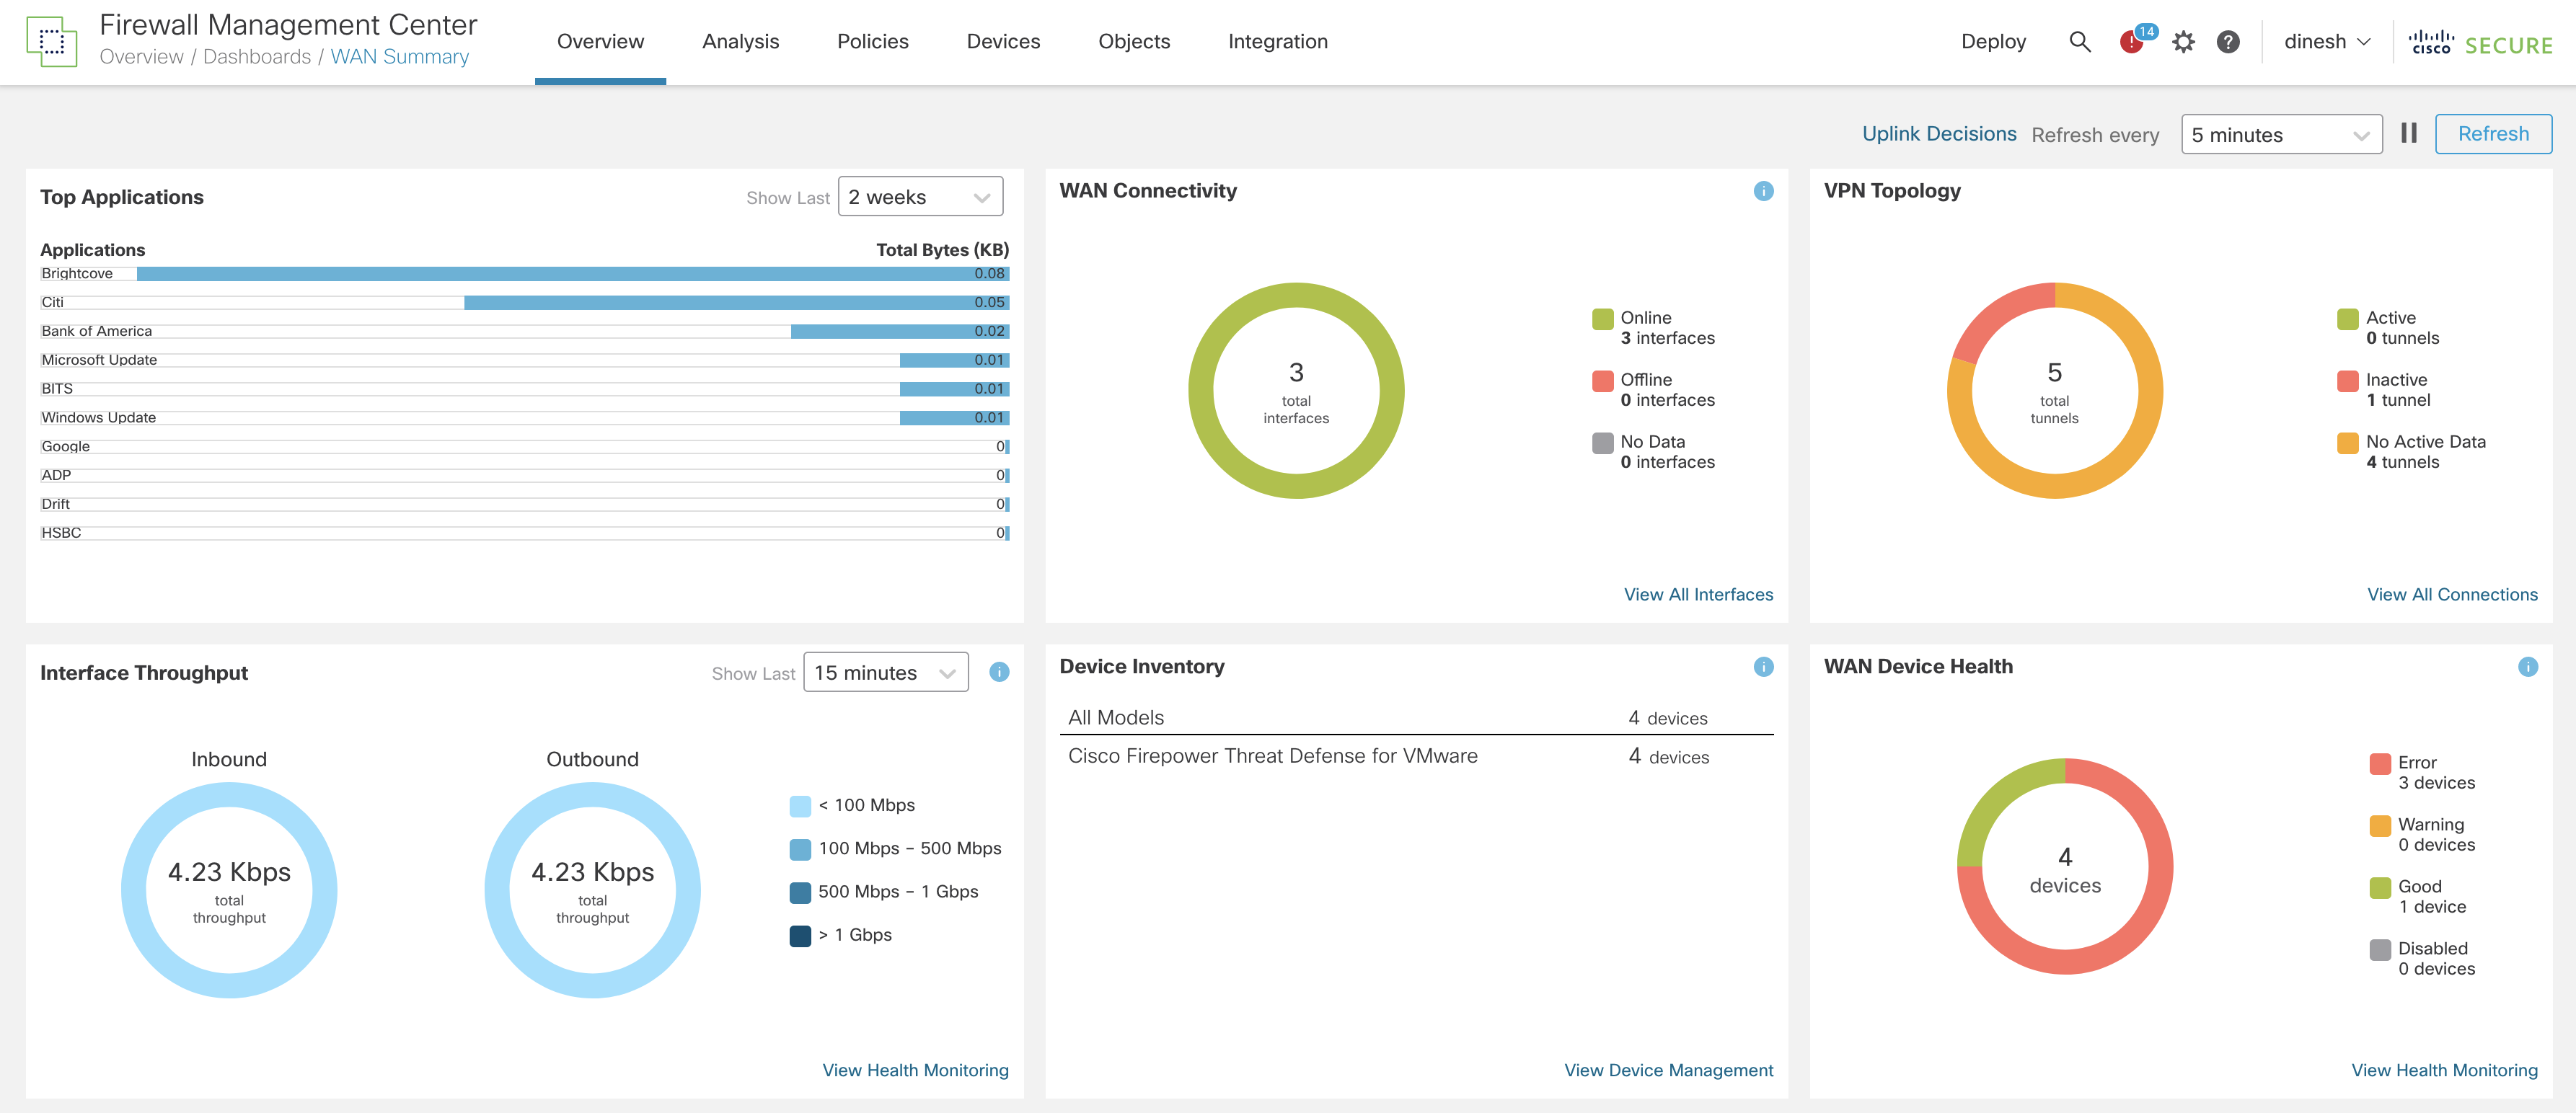
Figure 1: WAN Summary Dashboard
The dashboard consists of the following widgets:
- Top Applications
- WAN Connectivity
- VPN Topology
- Interface Throughput
- Device Inventory
- WAN Device Health
Top Applications
This widget shows the top 10 Applications ordered by the throughput (Higher throughput consuming applications are presented on top). Using the Time Range Selector toggle, network administrators can see the statistics (displayed as Total Bytes) for top applications that range from the last 15 minutes to 2 weeks.
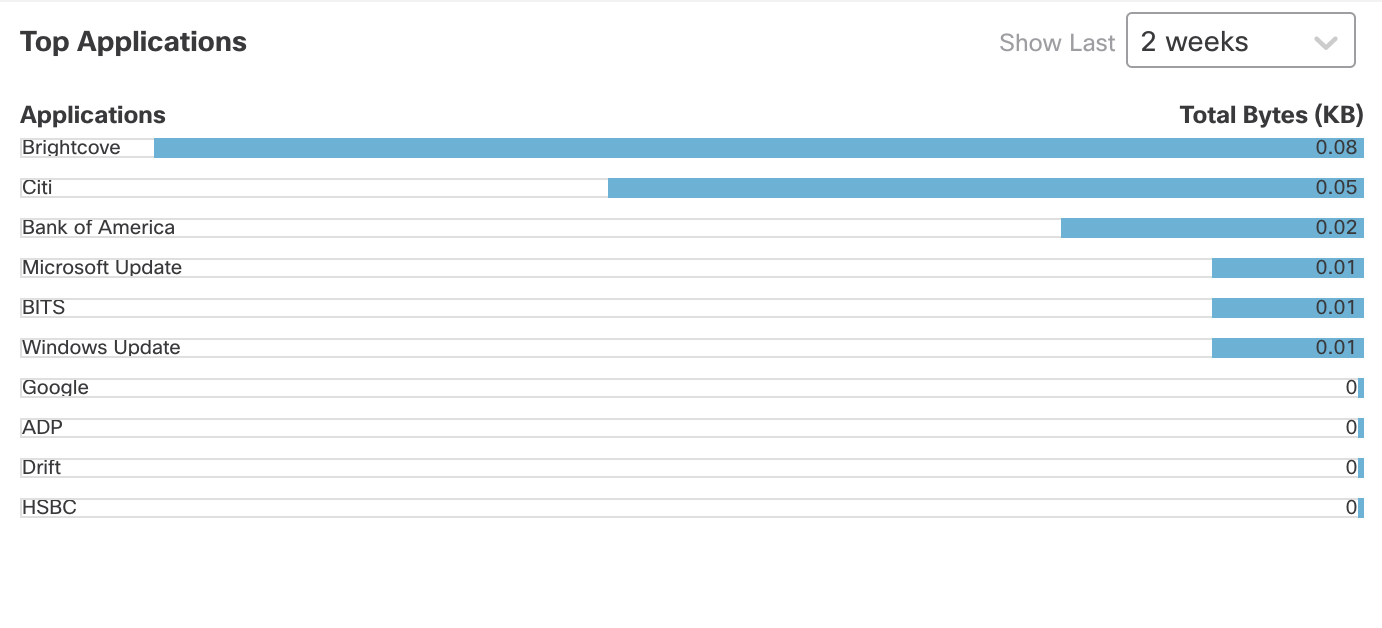
Figure 2: Top Applications Throughput Widget
WAN Connectivity
This widget provides consolidated information on the statuses of WAN interfaces. The path monitoring enabled interfaces in this widget are categorized as Online or Offline depending on their current status. The interfaces configured with path monitoring but not passing any traffic are categorized as No Data interfaces.
This widget also provides a quick cross-launch to the Health Monitoring page to view the health of all interfaces on WAN devices. This helps network administrators track the current status of WAN interfaces and helps to reduce the time required to troubleshoot issues related to overlay.
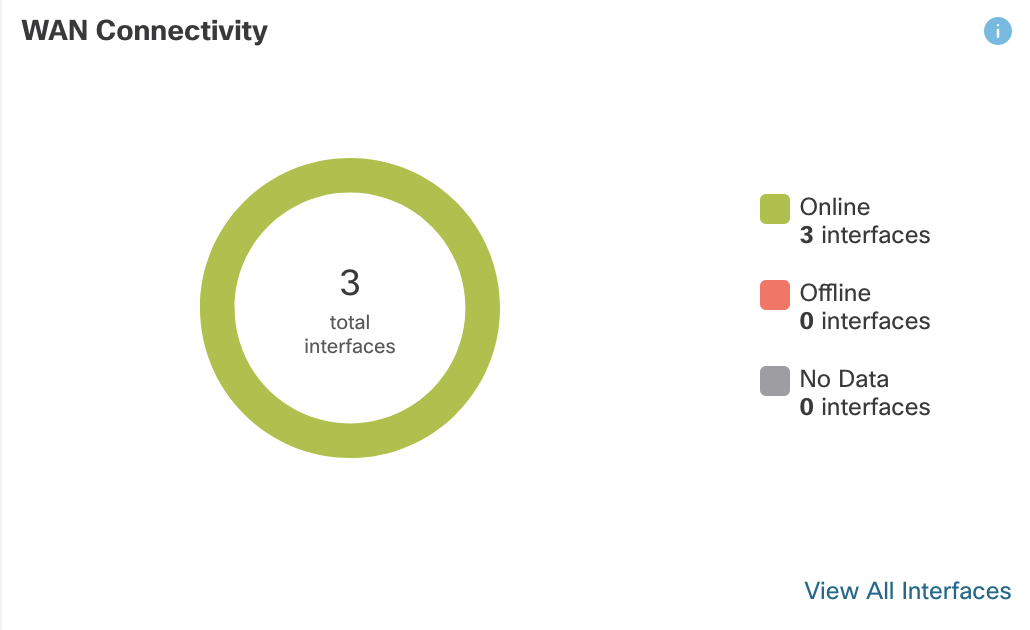
Figure 3: WAN Connectivity Widget
VPN Topology
This widget shows the distribution of Site-to-Site VPN tunnels and their corresponding statuses. Depending on the status, the Site-to-Site VPN tunnels are categorized as either Active, Inactive or No Active Data. The following section shows how the tunnel statuses are determined:
The tunnel shows up as Activetunnel under the following conditions:
- For policy-based VPNs, if the management center identifies interesting traffic through the tunnel after the successful deployment.
- For route-based VPNs, if they are configured correctly and deployed without errors.
The tunnel shows up as Inactive if it is idle due to inactivity or has been torn down due to networking/configuration issues.
The tunnel shows up as No Active Data until there is a traffic flow event through the tunnel for the first time. The No Active Data state also lists the policy-based and route-based VPNs that have been deployed with errors.
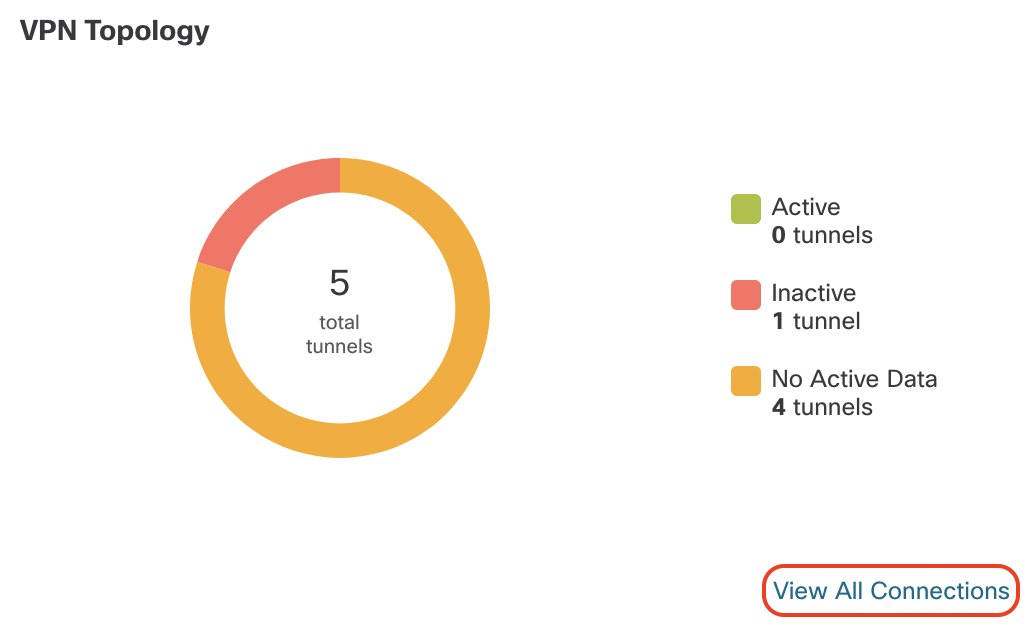
Figure 4: VPN Topology Widget
To review additional details about the Site-to-Site VPN tunnels, the widget provides View All Connections option i.e. a quick launch to Site to Site VPN monitoring dashboard.
Interface Throughput
This widget provides information about network-wide throughput utilization of WAN interfaces. The interface throughput is categorized into four bands(insert legend). These details help network administrators with cost planning and resourcing.
Note
To see data within the Interface Throughput widget, make sure you enable Interface Monitoring on the Health policy associated with the FTD devices.
To do so, navigate to System > Health > Policy > Device's Healt Policy, then click Network Card/Interface Widget and enable Interface Status.
Click View Health Monitoring to view more details about the interface on the Health Monitor page.
Similar to Top Applications, this widget also provides a Time Range Selector option which can be used to display the statistics for interface throughput that range from the last 15 minutes to 2 weeks.
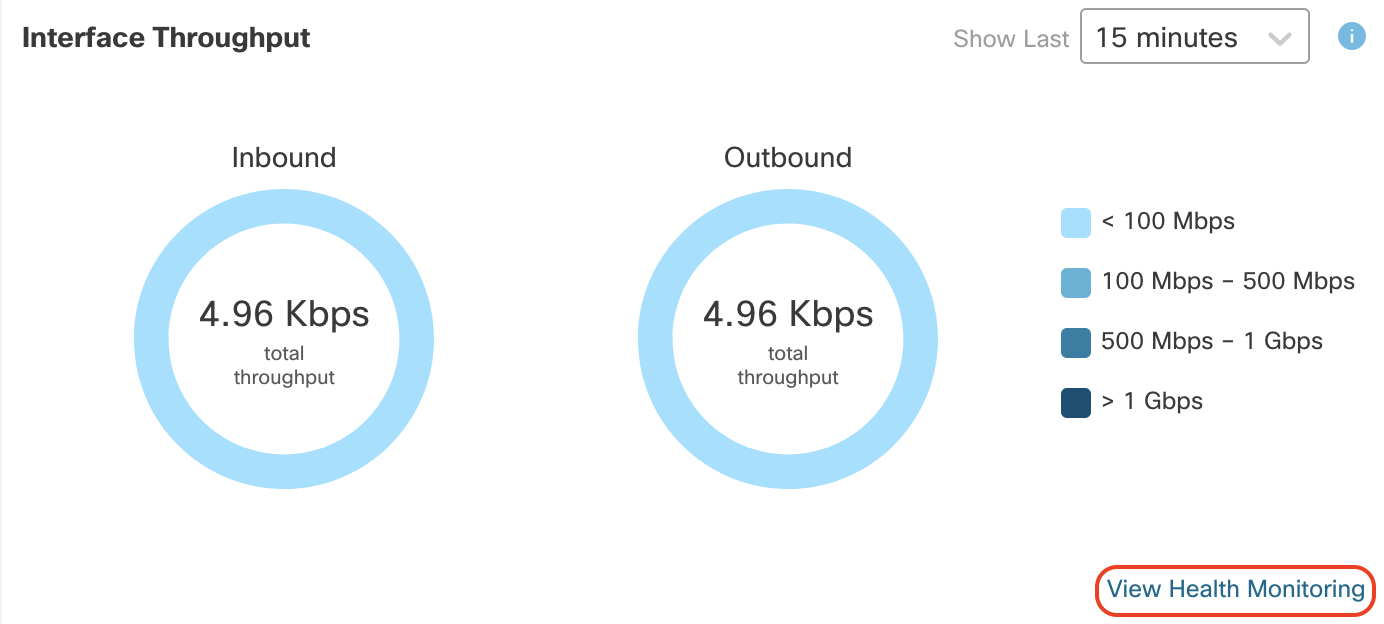
Figure 5: Interface Throughput Widget
Device Inventory
To provide a quick overview of WAN devices deployed in a network, this widget lists and groups the WAN devices according to their model. To view more details about the devices, click View Device Management that cross-launches the Device Management page on the Secure Firewall Management Center.
Please note that the widget only lists the devices that are designated as WAN devices based on the conditions defined in the Note early in this document.
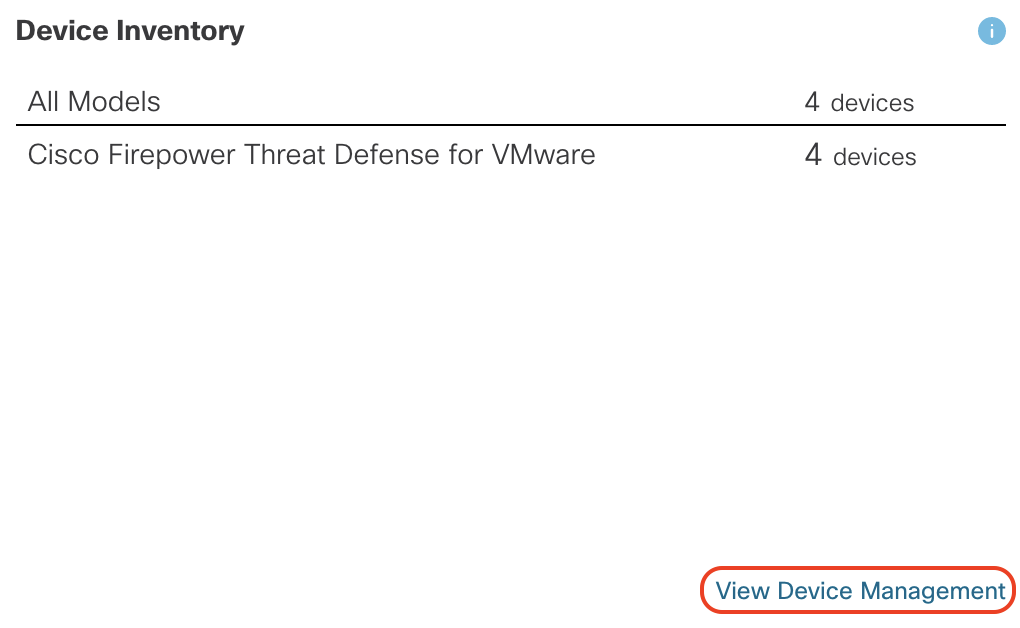
Figure 6: Device Inventory Widget
WAN Device Health
This widget displays the WAN device count distributed by their health statuses. Administrators can view the number of devices with errors and warnings. To view more device details on the Health Monitor page, click View Health Monitoring to quickly identify, isolate, and resolve issues. All the WAN devices are categorized in 4 ways i.e. Error, Warning, Good, and Disabled.
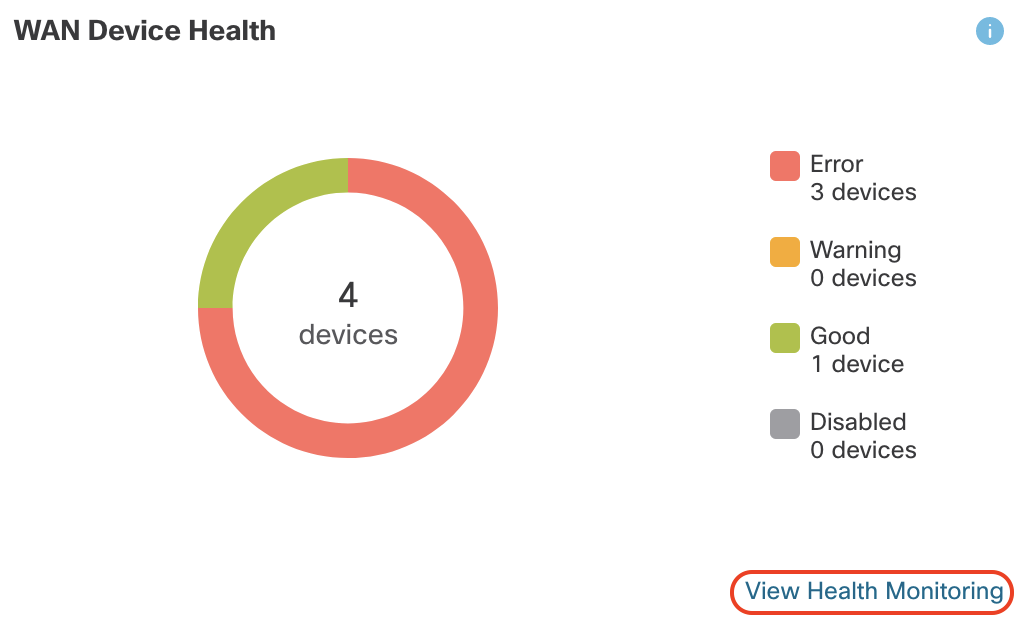
Figure 7: WAN Device Health Widget
Uplink Decisions
To view the events related to the change in path due to Policy Based Routing policies, click Uplink Decisions on the top right of the WAN Summary Dashboard.
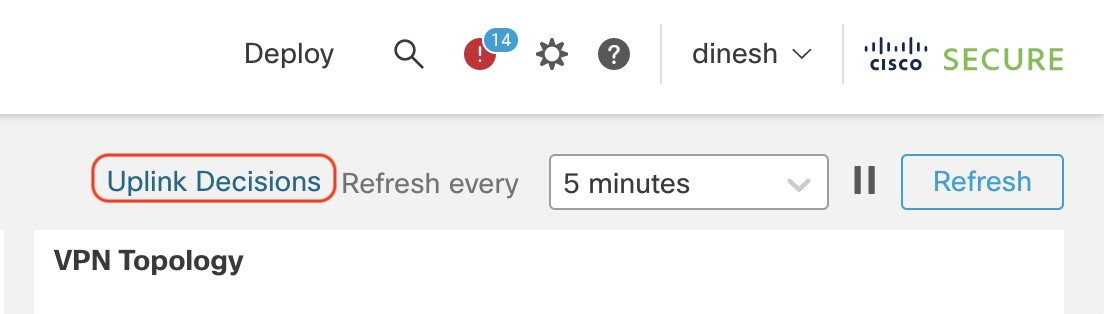
Figure 8: Uplink Decisions Option
This cross launches the VPN Troubleshooting page that displays the syslogs (with ID of 880001) that show interfaces that the threat defense chooses to steer traffic based on the path monitoring and also lists the reason why a certain interface/path was chosen over the existing one.
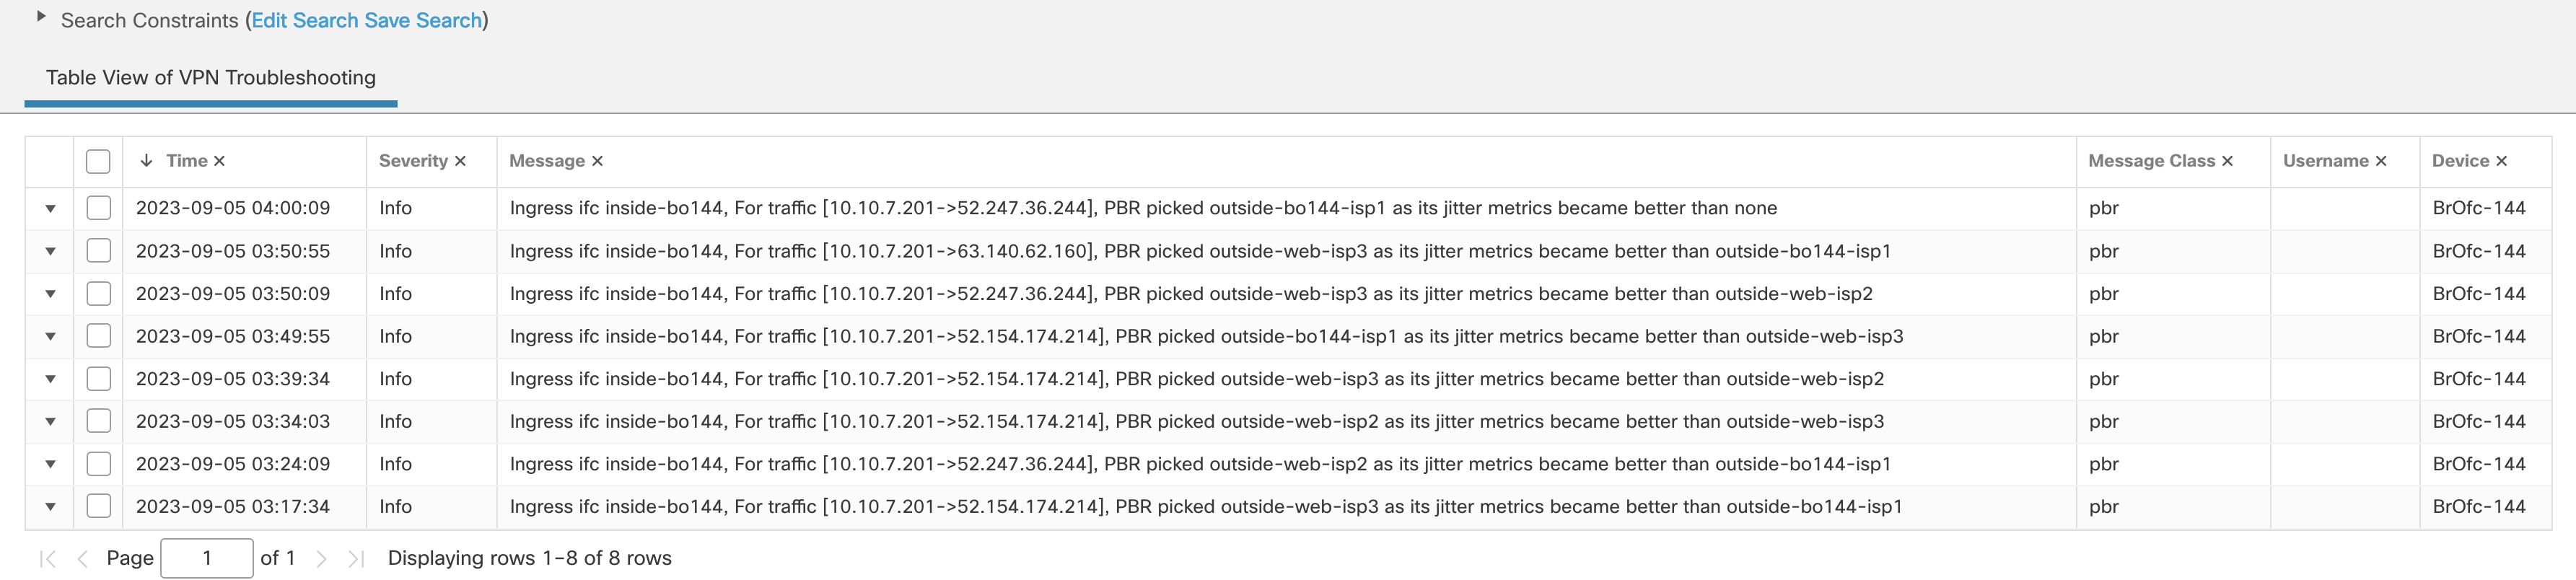
Figure 9: Uplink Decisions Cross Launch to VPN Troubleshooting Page
Summary
The new WAN Summary Dashboard provides a snapshot of your WAN devices and their interfaces. It provides insight into your WAN network and information about device health, interface connectivity, application throughput, and VPN connectivity. Administrators can leverage the dashboard to review details of their WAN devices, monitor the WAN links, and take proactive and prompt recovery measures.
📚Additional Resources
To learn more about the RA VPN dashboard, please refer to the following guide: